The stock market quote is a set of information about a specific stock that tells us about its price and other essential information. The aim of this article is to describe and understand this data.
To no one’s surprise, you need to understand the stock quote to make decisions about the stock market, in the same way that you need to know the alphabet before you can read. Only when you really understand a stock quote will you be able to make educated decisions about your investments, so let us start.

Stock market quote
When you buy a stock, after having made sure that you like and believe in the company, the second info you will want to know is the price. The stock market quote is there for exactly that: it will give you information about the bid and ask price – the price at which you can sell, and price at which you can buy, respectively – the trading volume, the yield of the stock, etc. We will explore each piece of information one by one in the next section.
Financial market quotes can be found in magazine and newspapers, but nowadays, they are mostly online, on mobile apps, websites and dedicated portals so that investors can have access to the prices in real time.
Example: Facebook Stock
For the purpose of the example, I took a screenshot of the Facebook stock from the Yahoo Finance website – if I did not take a screenshot, the stock price and data would continuously fluctuate and make it impossible for me to write. Remember that these are dynamic values. Let us explore each info and abbreviation one by one.
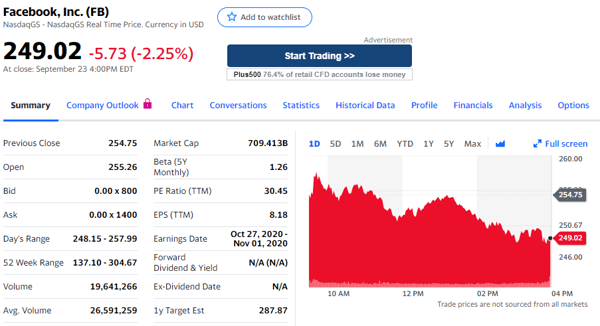
The name: This is straightforward but essential. This is the name of company according to the commercial register of the country.
Stock symbol (SYM): This is a short abbreviation, only a few letters, that represent the company on the market it is traded, often written between parenthesis. Facebook has a simple “FB”. As an example, Apple is “AAPL” and Tesla is “TSLA”.
Market: usually written under or near the company name, this is the name of the stock exchange on which the stock is traded. In the case of Facebook, it is the NASDAQ, who compiles all the largest U.S. technology companies (Tesla, Google, Facebook, Microsoft).
Price: this is the current price of the stock on the market. For a delayed version such as I have, the time of the price will be added (As of 11:12AM EDT here).
Change: this is the price difference between yesterday’s closing price and the actual price. It is expressed in dollars, and as a percentage next to it (in red).
Previous close: as mentioned in the last definition, the previous close or closing price is the price at which the stock was last traded during the last day.
Open: this is the stock’s price at the opening on the same day.
Bid price and ask price: they are the price at which one can sell and buy the stock respectively. Note that they are wrong on this screenshot as they are not updated live: the bid price should be below the stock price and the ask price should be above. Just ignore these.
Day’s range: those are the lowest and highest price the stock reached on that specific day, which gives us an info on its volatility.
52 Week Range: this shows the lowest and highest values the stock reached in the past 52 weeks or year. Note that this does not include the previous trading day.
Volume: this is the total amount of traded shares that day. Each single stock that is sold counts as one, and if it is sold and bought 3 times, it will count as three.
Average volume: this is the average volume that a normal trading day sees for the stock.
Market Cap: stands for market capitalization. This is the total value of all existing shares combined.
Beta: this shows the change of a stock relative to changes in the stock market. For example, if the Beta is 1.3, and the market goes up by 10%, you need to do 1.3 x 10 and it will mean that the stock is expected to move up 13%. The stock is 30% more volatile than the market.
PE Ratio: the price-to-earnings ratio (P/E) is the price of a stock divided by the earnings per share (EPS). This helps investors to compare the stock price and to gauge whether it is high or low compared to the market.
Earnings per share (EPS): This is the company’s earnings divided by the total number of shares. Obviously, the higher this is, the better.
Earnings date: this is the dates around which we can expect the publishing of the company’s earnings. This is generally interesting as bad or good earnings can have a impact on the stock price.
Forward Dividend and Yield: This is the estimation of the year’s dividend calculated as a percentage of the stock price.
Ex-dividend date: this is usually set one business day before the record date. If you bought the stock before this date, you will get the dividend, but if you buy past this date, the sellers will receive the dividend.
1y target est: this is the price that the stock should reach in a year’s time according to analysts. Note that this is only an estimation and should not be taken as granted.
Year-to-date percentage change (YTD% CHG): this is the stock price percentage change for the calendar year (adjusted for stock splits and dividends over 10%).
Additional information may be included in footnotes. It is also possible to find analyst recommendations showed below or the latest news related to the stock. Every source can choose to show the information they desire.
Key takeaways
The pricing displayed on a stock quote reflects the buying and selling activity that influences the value of the company. With each trading day, news and industry trends will influence the way investors see a company, something that will directly be translated on its price as they sell it and buy it. Other updates such as positive earnings or new technology findings can also make the stock fluctuate, as more investors may want to buy in the company. All of this data is reflected in stock quotes. Understanding how they work and the meaning of their different data will give you the tools you need to decide what you would like to buy.
The stock quote therefore gives you all the information you need, such as the value of a company, the stock performance, its volatility and the risks that come when buying in. One thing you should note is that stock prices are dynamic and change every second. As many website can have a delay of 20 minutes or more, do not trade based on what you see here, especially if you are day trading or scalping – I mean you can try, but good luck trading with a 20 minutes delay.

Sources:
https://www.thebalance.com/understanding-stock-quotes-3141313https://www.investopedia.com/terms/s/stockquote.asp