1109 days ago • Posted by Charles-Henry Monchau
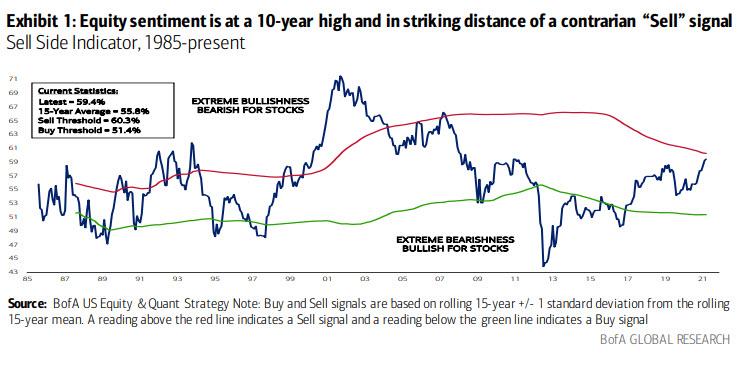
BofA "Sell" Signal is now at a 10-year high and the closest to a contrarian "Sell" signal (<1ppt) since May 2007
BofA Sell Side Indicator (SSI), which is the average recommended equity allocation by sell-side strategists, rose for a third month in a row to 59.4% from 59.2% (and 58.4% the month before that); it is now at a 10-year high and the closest to a contrarian "Sell" signal (<1ppt) since May 2007, after which the S&P 500 declined 7% in the subsequent 12 months... and 13% in the 12 month following "Sell".
Source: www.zerohedge.com, BofA