1251 days ago • Posted by Charles-Henry Monchau
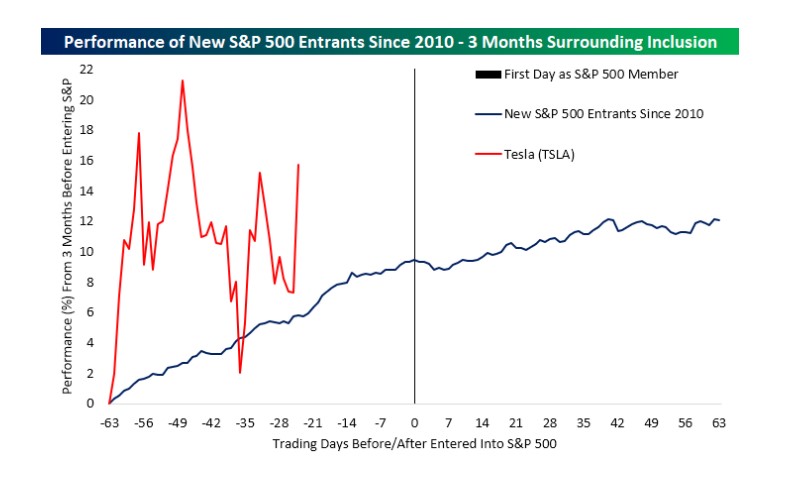
Tesla inclusion into the S&P 500 index, a buying opportunity?
The chart below by Bespoke depicts the performance of the stocks that have entered the S&P 500 in the past decade beginning three months before their entrance date (day number zero is the first day as an S&P 500 member) to three months after. As shown, historically over the past decade, new entrants to the large-cap benchmark have on average risen in the months leading up to inclusion. In the immediate days following inclusion, there is some sideways to slight downward movement but that is followed by a turn higher. As for what this means for Tesla (TSLA) in the months to come, recent history has shown new additions to the index have been treated well by investors, but TSLA has one major distinguishing feature: its size.