1175 days ago • Posted by Jasper Lawler
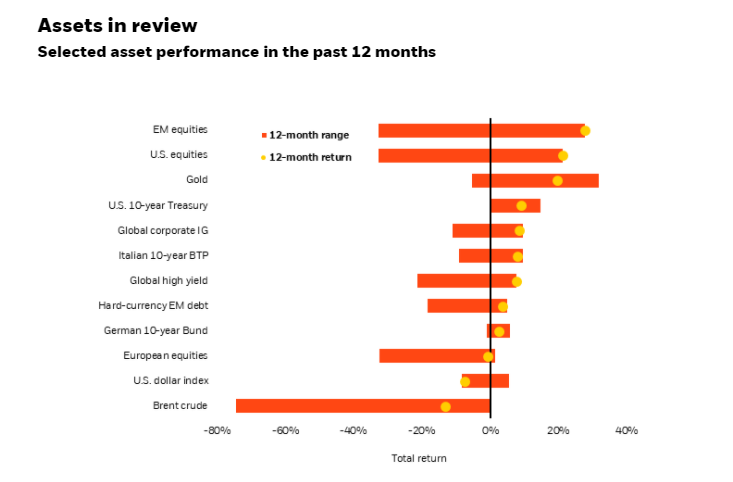
Looking at asset performance alongside the highs and lows shows extraordinary volatility
The two ends of the bars show the lowest and highest returns over the last 12 months, and the dots represent returns compared with 12 months earlier.
Emerging market (EM), high yield and global corporate investment grade (IG) returns are denominated in U.S. dollars, and the rest in local currencies. Indexes or prices used are: spot gold, Datastream 10-year benchmark government bond (U.S. , German and Italy), MSCI USA Index, Bank of America Merrill Lynch Global Broad Corporate Index, MSCI Emerging Markets Index, J.P. Morgan EMBI index, Bank of America Merrill Lynch Global High Yield Index, the ICE U.S. Dollar Index (DXY), MSCI Europe Index and spot Brent crude.
Sources: BlackRock Investment Institute, with data from Refinitiv Datastream, January 2021. Notes: