1270 days ago • Posted by Charles-Henry Monchau
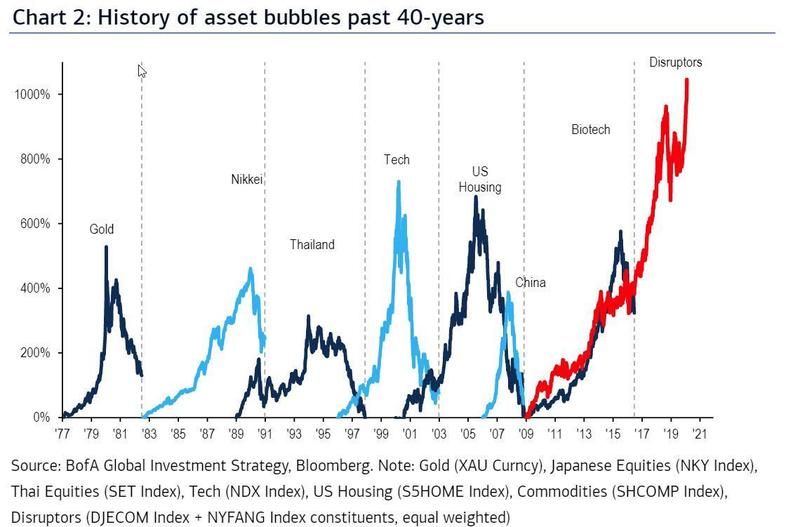
The "Disruptors" bubble and 10 surreal U.S equity market numbers and facts
David Stockman asks some interesting questions: 1) “How could the S&P 500 be trading at its highest multiple in 70 years when the growth rate of corporate earnings has been sinking for more than two decades?”; 2) “The recent S&P index value implies a PE multiple of 36.8X—a place the S&P 500 has never been before.”; 3) “The forward PE is now above the record high reached during the dot-com madness at the” end of the 1990s; 4) Amazon, a company that didn’t exist pre-1994 is “43% of the S&P 500 consumer discretionary index.”; 5) “Nearly two-thirds of the market is underperforming so far this year.”; 6) “Year-to-date, only one in three stocks is actually in the green.”; 7) “One in five stocks is down 50% or more from its all-time high.”; 8) “The five largest stocks in the S&P 500 have a combined market cap that equals that of the ‘smallest’ 389 stocks.”; 9) “Apple, Amazon, Microsoft, and Google—four companies—have a combined market cap (over $6 trillion) that is greater than the GDP of every country in the world, minus the US and China.”; 10) “Tesla, having surpassed Walmart (with one-twentieth of the revenue!), has become the ninth-largest stock in the US.” - source: Sebastien Schaefer, BofA