1250 days ago • Posted by Charles-Henry Monchau
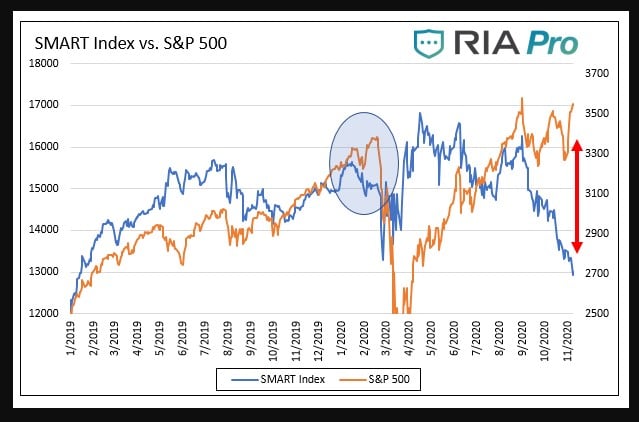
Chart of the day: There is a massive divergence between the S&P 500 and the Smart Money Flow Index
Mike Lebowitz: "Bloomberg’s Smart Money Flow Index is a measure of how ‘smart money’ is positioning itself in the S&P 500. The logic behind the index is that smart investors tend to trade near the end of the day, while more emotional-based traders dominate activity in the first 30 minutes of the trading day. The index is calculated as follows: yesterday index level – the opening gain or loss + change in the last hour. As shown below, the Smart Index and the S&P were well correlated until late August. Since then, as highlighted by the red arrow, they have diverged sharply. Over the last ten years, the S&P 500 and the Smart Index have a strong correlation of .65. As such, we expect they will converge in time. The light blue circle shows they also diverged, albeit to a much lesser extent, in January and February as the smart money correctly sensed problems.” - source: RIA


