Understanding the importance of technical indicators in trading is essential for any trader looking to make the most of their short-term trading strategy. Indicators like the Stochastic Oscillator can be incredibly useful in predicting potential price reversals, playing a pivotal role in your decision-making process. However, selecting the best technical indicators isn't always straightforward. It's imperative to learn how to choose the right technical indicators based on your personal trading style, objectives, and risk tolerance. This knowledge can prevent falling into the trap of common mistakes when using technical indicators, such as relying solely on them for buy or sell signals or using too many that may generate conflicting signals. In addition, it's quite beneficial to study case studies of successful trades using technical indicators, as they offer practical insights and help develop a deep understanding of these complex tools. When used correctly, technical indicators can make a significant difference to your trading success.
So, don't risk using the wrong ones. Keep reading to deepen your understanding and enhance your trading strategy.
Contents: Best Technical Indicators for Short Term Trading
- What is a technical indicator?
- Importance of technical indicators in trading
- Types of technical indicators
- 3 Best Technical Indicators
- Moving Averages (MAs)
- Relative Strength Index (RSI)
- Average True Range (ATR)
- Stochastic Oscillator
- How to choose the right technical indicator
- Putting it all together into a trading strategy
- Common mistakes when using technical indicators
- Case Studies of successful trades using technical indicators
- How to start using technical indicators
Definition: What is a technical indicator?
Technical indicators are mathematical equations that use price data, including the opening price, closing price, price highs and price lows (OHLC). They are displayed either on top of price, known as overlays or beneath the candlestick chart, known as underlays.
Technical indicators can be used in day trading any market. Popular short-term trading markets, where technical indicators can be used include forex trading, commodity trading, indices trading and are very popular with crypto traders.
.png?width=1000&name=shutterstock_729637132%20(1).png)
The reason for technical indicators is to present what the price action is showing in a different visual way that can inform the trader on information such as trend, volatility, overbought or oversold conditions or give buy and sell signals.
Importance of technical indicators in trading
Technical indicators play a critical role in trading, acting as tools to predict future market movements and help investors make informed decisions. There are several reasons why technical indicators are vital:
- Signal Generation: Technical indicators generate buying and selling signals based on historical data. For instance, moving averages can indicate a possible trend reversal, prompting a trade.
- Confirmation: They also act as a confirmation tool in technical analysis. Traders often use multiple indicators to confirm a particular market movement.
- Risk Management: Technical indicators can help manage risk. For example, a trader can set stop losses based on support and resistance levels identified by technical indicators.
Types of technical indicators
We have chosen 3 different types of technical indicators, where each indicator performs a separate function from the others. This means there is no conflicting information, and each technical indicator compliments the others.
These 3 functions are: trend following, momentum and volatility.
3 Best Technical Indicators
The following list of what we think are the best technical indicators for day trading is not exhaustive but includes some of the most popular indicators for day trading on short timeframes. Over time, you might choose to change the settings on the indicators, use customized indicators or even create your own custom technical indicator.
- Moving Average (SMA or EMA) for Trend following
- Relative Strength Index (RSI) for Momentum
- Average True Range (ATR) for Volatility
1) Moving Averages
What is the moving average indicator? Anybody who has looked at a price chart will know that prices fluctuate wildly. The moving average attempts to smooth out this price action by taking the average price over a rolling number of periods. The result is a smooth line that tracks behind the candlesticks or price bars, overlayed on your chart.
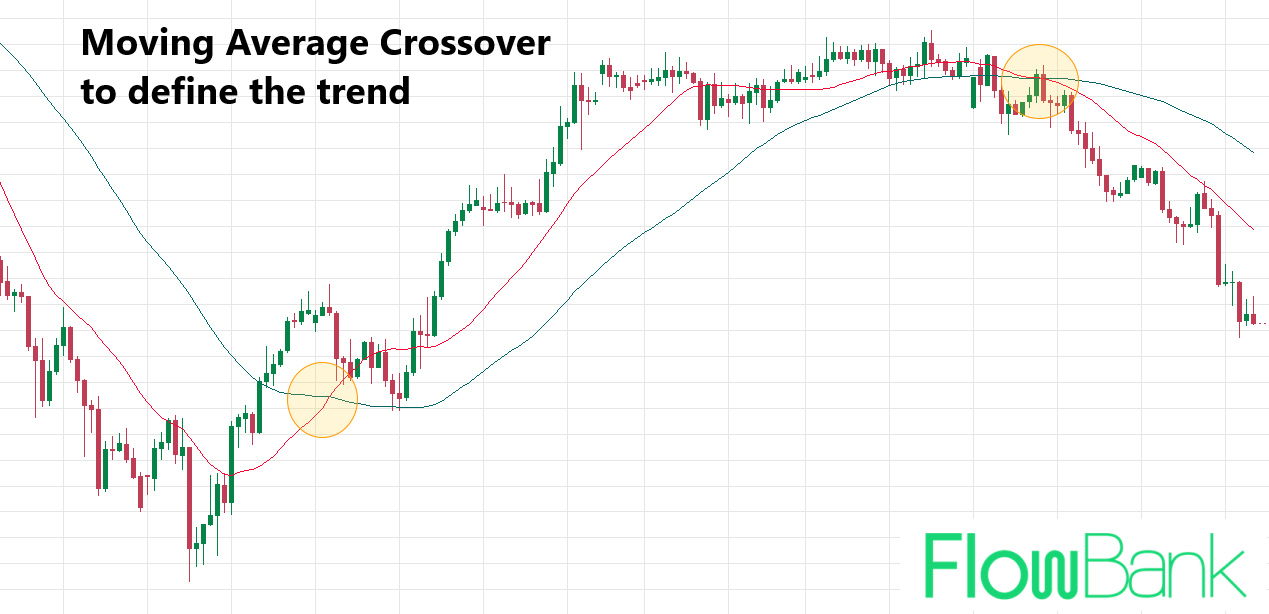
How moving averages are used: The smoothed line makes it easier to determine the trend of the market. If the line is sloping up, the trend is up, while if the line is sloping down, the trend is down. Moving averages can also provide trade signals when price crosses the moving average or when a shorter-term moving average crosses a longer-term moving average.
Why a moving average is good for short-term trading: Moving averages are primarily designed for trend following. SMAs and EMAs are lagging indicators, which means the price needs to move first, and then the indicator will react to that change. The benefit is that they smooth out the market ‘noise’ but the downside is that they can be slow to show that the trend has changed at turning points.
While popular settings for long-term traders include the 50-day moving average and 200-day moving average, the indicators will adjust according to the timeframe you are trading. Using a one-hour chart, the 20-period moving average will adjust to 20 hours.
2) Relative Strength Index
What is the RSI indicator? It is an oscillator, which means it displays as an underlay indicator and fluctuates between readings of zero to one hundred. The maths behind the indicator is comparing the size of ‘up moves’ versus ‘down moves’ – so the idea is it compares the ‘relative strength’ of the bulls versus the bears.
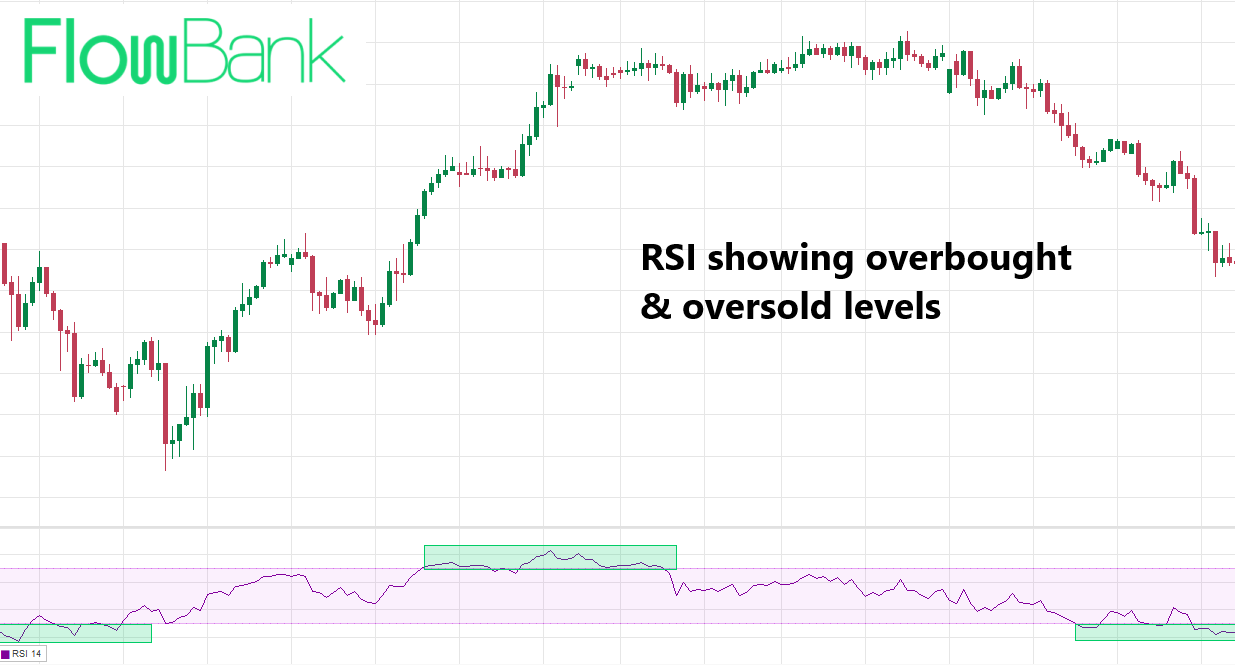
How the RSI indicator is used: It is most commonly used for finding overbought and oversold conditions in the market. Meaning price might have moved too far too quickly, and could be about to reverse. Traders will also compare the swings in the RSI indicator with swings in the price to find divergence between the two. Divergence is another signal to show the current price move might be about to reverse.
Why it is good for short-term trading: On short timeframes, price can change direction quickly. Momentum indicators like RSI are a leading indicator, which means the RSI will often change direction before the price. This can give traders an early warning signal to exit a trade before the price reverses. The drawback is that RSI can display false signals, suggesting a trend will change when it doesn’t.
The default settings for RSI are using 14-days but dropping down to lower timeframes like the one-hours chart will produce an RSI constructed using 14 hours of price data instead.
3) Average True Range (ATR)
What is the ATR indicator? The Average True Range can be written as a single number or presented on the chart as an underlay, tracking how the figure has changed over time. It shows the average number of points a market has moved over a certain time period. The typical setting is 14, meaning it measures over 14 periods.
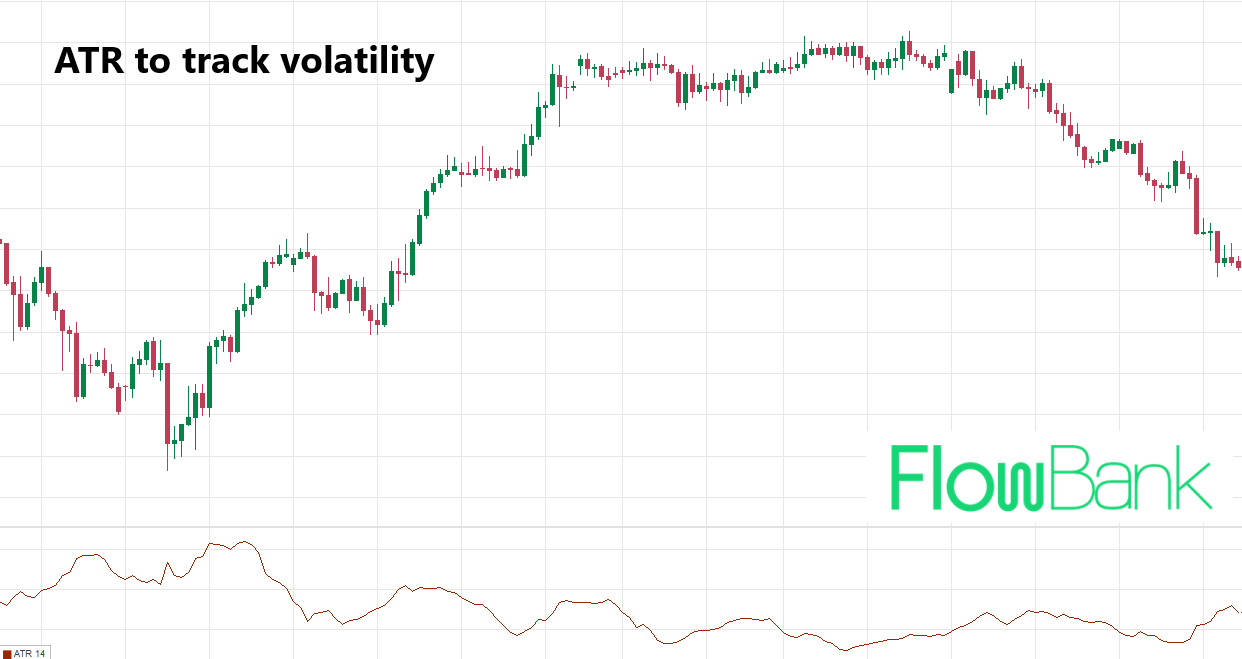
How the ATR indicator is used: It is used as a measure of realised volatility, i.e. how much the price of a market has been moving over a certain period of time. This is useful information for day traders who are trying to decide where to place stop loss and take profit orders. For example if a stock or forex trade is expected to last several hours, typically the stop loss would need to be at least 1X of the 1-hour ATR(14).
Why it is good for short-term trading: As a short-term trader, it can be tempted to get drawn into longer-term trades as the price moves up and down. The ATR can serve as a benchmark for where to set profit targets and cut losses.
Like with the above indicators, the trading platform will adjust the timeframe settings to lower timeframes to adjust for short-term trading. Thus, the trader can use a 14-hour ATR instead of a 14-day ATR for more accurate information on short-term volatility.
Stochastic Oscillator
The Stochastic Oscillator is a popular momentum indicator used in technical analysis. It compares a particular closing price of a security to a range of its prices over a certain period. The oscillator's values range between zero and one hundred. Here are key points to remember:
- A reading above 80 is typically considered overbought, suggesting that a reversal may soon occur.
- Conversely, a reading under 20 is considered oversold, indicating a possible upward reversal.
- The Stochastic Oscillator also helps identify divergence. If the price is making higher highs but the oscillator is making lower highs, this is known as bearish divergence - a potential sell signal. The opposite scenario is known as bullish divergence, a potential buy signal.
How to choose the right technical indicator
Choosing the right technical indicator for your trading strategy is critical to your success in the financial markets. The best indicator for you will largely depend on your trading style and the type of market you're trading in.
- Understand Your Trading Style: Different trading styles, such as swing trading, day trading, or long-term investing, require different technical indicators. For example, a day trader may use moving averages and the Stochastic Oscillator, while a long-term investor may prefer to use the MACD or RSI.
- Market Conditions: Certain technical indicators work better in different market conditions. Trend indicators, like moving averages, are useful in trending markets, while oscillators like RSI or the Stochastic Oscillator are more beneficial in range-bound markets.
- Complexity: Some technical indicators are more complex than others, and require a deeper understanding of technical analysis. Choose an indicator that you can understand and apply effectively.
Putting it all together into a trading strategy
The following chart shows each technical indicator performing a function, which combined can form part of your day trading rules based strategy.
Good short-term trading opportunities come about when all three indicators work together.
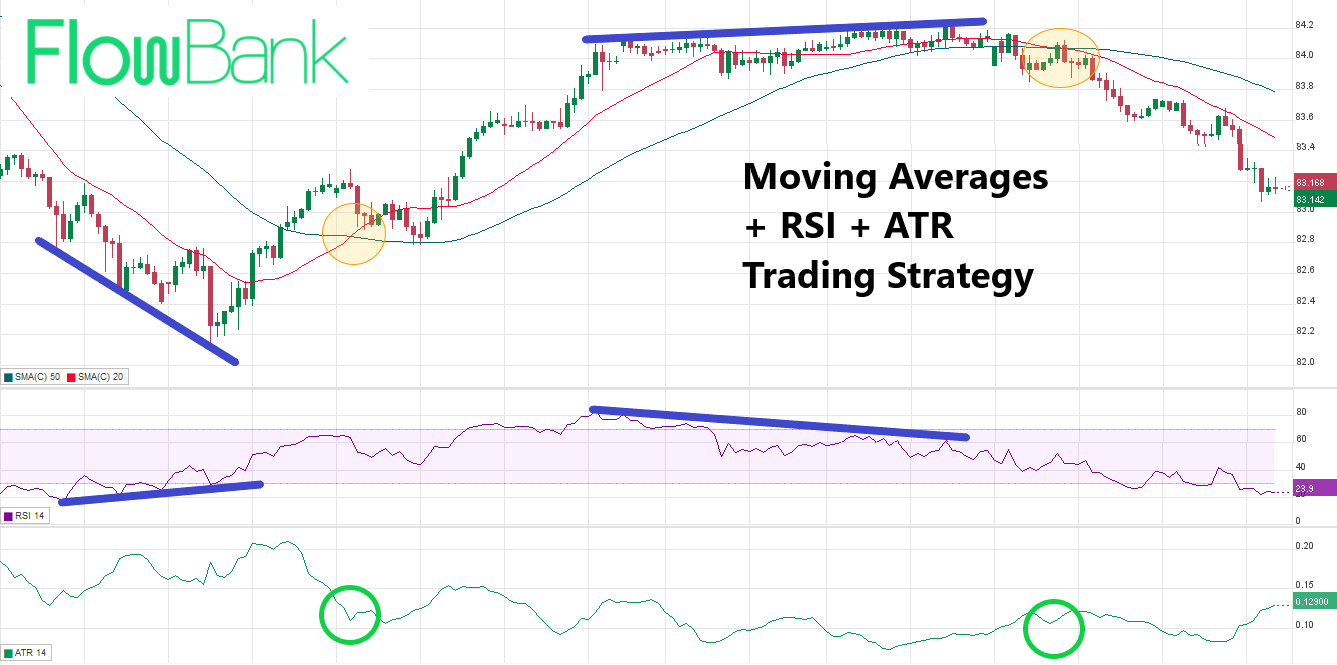
- The moving averages show the trend and trend reversals
- The RSI shows the momentum of the price move and when the momentum slows
- The ATR shows how volatility moves up and down, confirming the best signals when volatility is low and about to pick up.
Common mistakes when using technical indicators
Although technical indicators can be highly useful tools, traders often make mistakes when using them. Here are some common errors:
- Overreliance on Indicators: Remember, indicators are just tools and should not be the only factor considered when making trading decisions. Fundamental analysis and market sentiment should also be considered.
- Using Too Many Indicators: Using too many indicators can lead to confusion and contradicting signals. It's better to master a few key indicators.
- Misinterpreting Signals: Indicators can sometimes give false or conflicting signals. It's crucial to understand the ins and outs of the indicators you're using to avoid misinterpretation.
Case Studies of successful trades using technical indicators
Technical indicators have been used to make profitable trades in all kinds of markets. Here are a few examples of successful trades using technical indicators:
- Using the Moving Average: In 2016, traders who used a 200-day moving average strategy on the S&P 500 index were able to avoid a major downturn and make profitable trades.
- Stochastic Oscillator Success: In 2017, traders who used the Stochastic Oscillator were able to identify overbought conditions in Bitcoin's rapid rise, and could have profited from the subsequent correction.
- MACD Indicator Success: During the oil price collapse in 2014-2015, traders using the MACD indicator would have spotted a bearish divergence pattern signaling a decline in oil prices.
How to start using technical indicators
The FlowBank Pro Trading platform offers all the most popular technical indicators, and they can be tested by beginner traders on a demo trading account.
FlowBank offers the latest advances in online trading technology with the safety of a Swiss Bank Account.