A death cross in gold price is a technical indicator used by traders looking for signs of a bear market and it looks like one is imminent in gold.
Key Takeaways
- Gold is close to completing a bearish technical analysis setup known as the death cross
- A death cross happens when the 50-day moving average crosses beneath the 200-day moving average
- The occurrence can often be a headline-grabber but it’s history of success as a predictor of a new bear markets has mixed success
- An evaluation of past death crosses does provide some useful context for the current price action in gold
- Bigger picture, all the government borrowing, and money printing is good for gold but it could be that a lot of what has already happened has been priced in
Definition: What is the death cross?
The so-called ‘death cross’ is when the 50-day moving average crosses below the 200-day moving average in a market. It is a specific variation on a ‘crossover signal’ used by some technical analysts where a short term moving average crossing over a longer term moving average indicates a change in trend.
The death cross is interpreted as bearish because the short-term average is interpreted to be a leading indicator of what the longer term moving average will eventually do. I.e. first the short-term trend reverses, then if it persists long enough, the longer term trend turns lower too.
The death cross is opposite to the ‘golden cross’ which is when the 50-day MA crosses above the 200 MA.
The death cross for gold
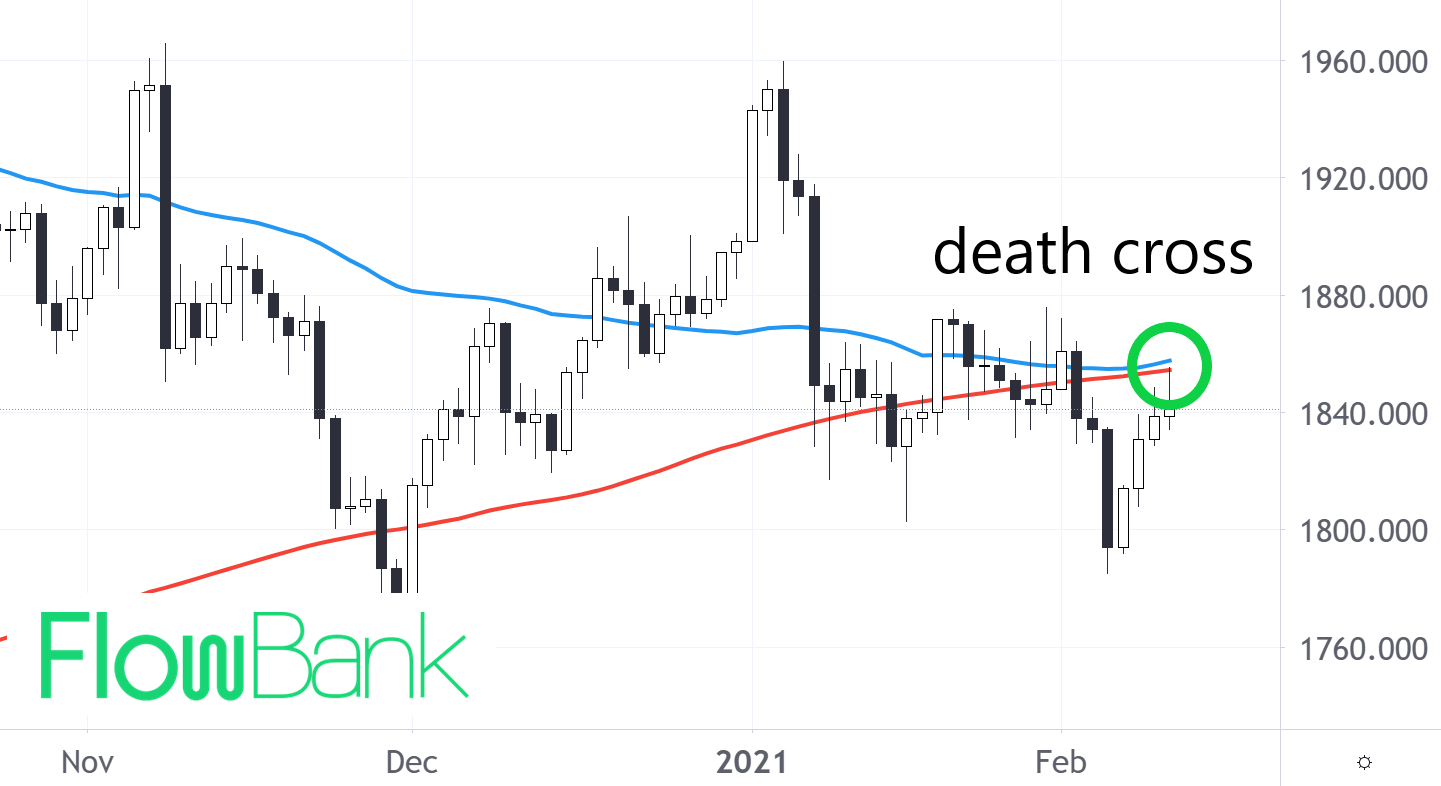
Technically the gold death cross has not yet happened, after a 4-day rally in the gold price, the moment of truth has so far been avoided. However, it seems likely that upon the next one or two big down days in the price, the two moving averages are likely to crossover. If however, the crossover does not happen and the moving averages start to diverge again, this makes for a much more positive outlook for the price of gold to invest in.
Is the death cross an accurate predictor for gold?
As always, the answer is both yes and no!
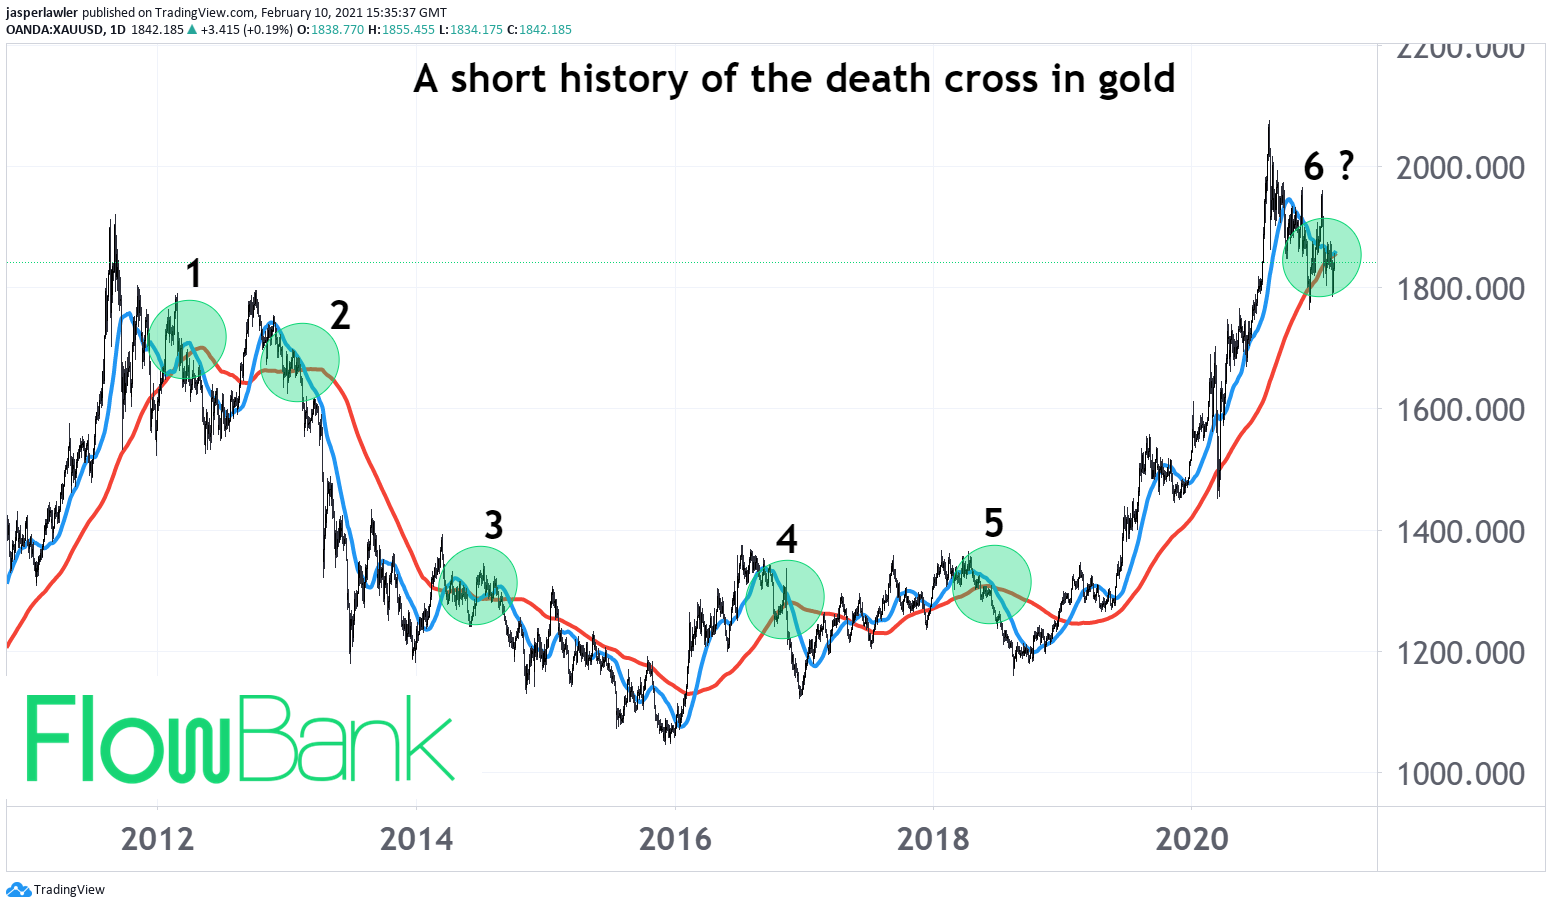
A look at the chart below shows that in the past decade, the ‘death cross’ has generally been followed by a down move in the price, but the length of that down move varies quite considerably.

1. Price of Gold and Silver moved lower after the crossover but the drop stalled at major support and the price rallied back way past the entry sell signal
2. The best example. Here the death cross comes early on in what became a massive downturn in the price of gold.
3. The first instance is a false signal as the price moves sideways. The second instance nicely times the final leg lower before the gold price puts in a long term bottom in late 2015.
4. Although the price does move lower following the cross, the signal provides little useful information about the future trend, which turns sideways
5. Same as point 4
6. The setup looks like a repeat of the point 1, which would imply a period of sideways price action may render the signal useless. The last gap between a death cross and golden cross in gold took seven months. Were that to repeat, it implies a wait until September for gold for turn bullish again.
How to use the death cross for trading
Like all technical indicators, the death cross in gold should not be taken in isolation. The signal should be complemented with other technical tools, observations and fundamental analysis.
Some other technical observations for the current situation in gold:
- Gold has been in a correction since surpassing $2000 per oz for the first time
- Price has pulled back roughly 10%, a 20% pullback is the definition for a bear market
- There is support near $1800 as well as the 2012 and 2013 peaks
What is the bigger picture for Gold price?
Gold in our view remains a hedge against currency and specifically dollar devaluation, a process that is continuing today with quantitative easing from all the major central banks. The pullback and imminent death cross in gold probably reflects a view in the market that QE will have to be tapered and bond yields will continue to rise in reaction to the global growth recovery as well as a dearth of new supply. By extension, the intended money printing over the next few months was likely priced into gold when it hit $2000 per oz.


