Harmonic Trading is a way to analyse financial markets by recognising specific price patterns and the alignment of Fibonacci ratios to determine potential reversal points.
This methodology assumes that trading patterns or cycles, like in life, repeat themselves. The key is to identify these patterns, and to enter or exit trades based upon a the probability that the same historic price action will occur.”
(Based on ”The Harmonic Trader”, Scott M. Carney)
Harmonic Patterns to make Fibonacci more objective
A popular question about using Fibonacci: How to boil down through the dozens of ratios and lines on the chart to something that can actually be used?
There are a lot of Fibonacci levels and, in theory, it is possible to trade off of every single one of them. But, with that said, it is generally not advisable. This is where Harmonic Patterns attempt to make the process more objective. Harmonic patterns match a specific Fibonacci ratio to a particular context in which it occurs. In this way fibonacci retracements, extensions and projections can be used to objectively define which levels are important and which ones should be ignored.
How to read Harmonic Patterns
Here below is two typical Harmonic Patterns (Bat), one with a possible bullish turning point and one with a possible bearish turning point. It’s amazing how simple these patterns are to find!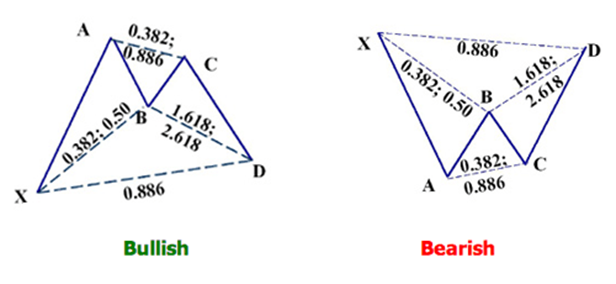
Each letter in the pattern represents a high or low pivot level with the exception of the D point, representing a possible pivot level.
When defining a pivot level within Harmonic Trading you use the specific Fibonacci levels for each pattern where the price meets the rules and form a turning point.
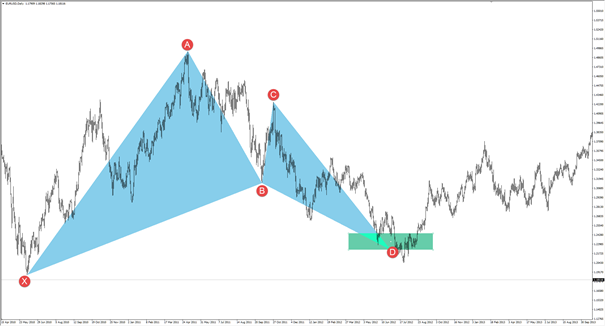
The D point is where the trade could be entered while everything else in the pattern is there to help identify an exact level where the D point will fall.
The relationship between the different points (except one) are an interval of Fibonacci levels. The following five steps show how to find each point (X, A, B, C, D):
1. Identify a distinct starting point (X). Usually a clear high or low price point looking at the closest historical price movements.
2. The A-point is the first pivot point that is found at the end of an initial move up or down. This point does not have to be measured in with Fibonacci but is used when determining where both the B-point and the D-point will fall.
3. The next move will show us where the B-point will be located and is one of the defining levels to decide what pattern we are looking at. It is measured by taking the Fibonacci retracement from X to A and will, for example in a Bat pattern seen above, have to be somewhere between 38.2% and 61.8%. (Ideally in Bat we are looking for a 50% retracement).
4. Next move, to the C-point can end somewhere between 38.2% and 88.6% of the distance between the A and B points - a Fibonacci retracement of the previous price move from A to B.
5. The D-point, consisting of several Fibonacci levels to determine the exact level we are looking for, and contains in this case, an exact ratio of 88.6% retracement of the distance between points X and A.
To dig deeper and determine the most important level, there are some extra ideas to consider.
• AB=CD structure exists (whether encompassed by price swing XA or poking out beyond it) that is somewhere between a 1:1 (AB actually equals CD) or 1:1.618 (CD leg is longer).
• The ratio the B point falls on (in relationship to the XA swing) tells you what kind of pattern you’re looking at (eg .50 = bat, .786 = butterfly, etc).
• Knowing the pattern type tells you the primary ratio around which the D point should fall. This ratio, like the B point, is a percentage of the XA swing.
• The BC extension and AB=CD projection tell you how much further (if at all) to look past the XA-defined level for the pattern to complete.
The result is three levels that form a zone. The BC extension level, the AB=CD projection level and the primary ratio for each pattern. Although we call this a ”zone”, this whole process is about finding one number, one ratio level.
These three ratios don´t always fall in the same order and it is the ratio identified to be lowest (bullish pattern) or highest (bearish pattern) that is most important when you continue to identify, verify and execute your trade.
Pulling the trigger
The Harmonic pattern provides the price zone where the reversal could take place. For execution, using a smaller timeframe or other technical analysis techniques like price action, candlestick patterns and indicators like RSI can strengthen and confirm the trade setup.
Read ou next article: Client sentiment good data vs cambridge analytica bad data