

Failure by Congress to raise the $31.4 trillion debt ceiling could have huge economic repercussions. These fears are starting to show in the treasury market and could spill further into the equity market.
The debt limit, which caps the total amount of allowable US federal debt, reached its ceiling of $31.4 trillion on January 19, 2023. Since then, the Treasury Department has been taking “extraordinary measures” to continue. However, time is running out.
Congress must agree to raise the debt ceiling for the US Federal Government to be able to meet its financial obligations. If the government cannot borrow to pay its bills, it defaults, which raises doubts over the reliability and credit rating of the US.
Why could the debt ceiling be an issue?
The US has never defaulted before. The US economy and, more broadly, the global financial system are underpinned by the idea that the US Federal government will always pay its bills. This is best seen in US debt, considered a risk-free investment, which means that the government pays less to borrow.
The US Congress is locked in an impasse over raising the debt ceiling, risking a default that could accelerate the US economy’s slide toward a recession. The risk of default comes at a time when there is already heightened uncertainty surrounding financial stability and inflation.
The negative consequences of the failure to raise the debt ceiling and the US defaulting cannot be overstated. As US Treasury Secretary Janet Yellen warned earlier this week, a US default would trigger an “economic catastrophe”.
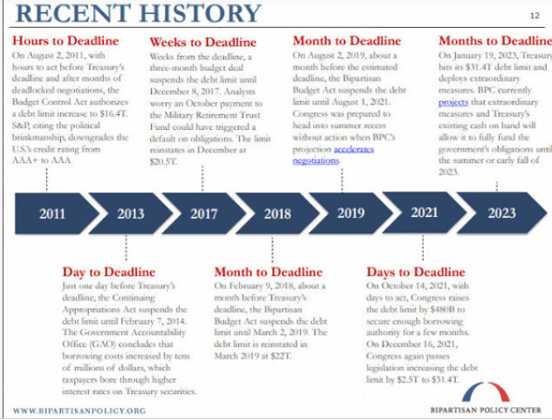
Timeline for the debt ceiling
The Treasury Department is expected to release an updated “X-date” in the coming days. This is when the US can no longer meet its obligations, and it will be updated based on fresh tax revenue data.
Estimates for the default deadline have varied widely because the date depends on tax collection. Lower than-expected April tax revenues have fueled concerns that the treasury could run out of money sooner. With the Treasury cash balance at roughly $250 billion, an X-date could be as soon as early June. The chart below shows a recent history of what happened and how close the US came to defaulting.
What are US Treasury yields saying?
Signs of nervousness are appearing in the Treasury market amid an unprecedented dislocation of the 1-month and 3-month Treasury yields. Treasury bills (considered risk-free investments) attract safe-haven flows in times of uncertainty. As investors buy into treasuries, the yield drops.
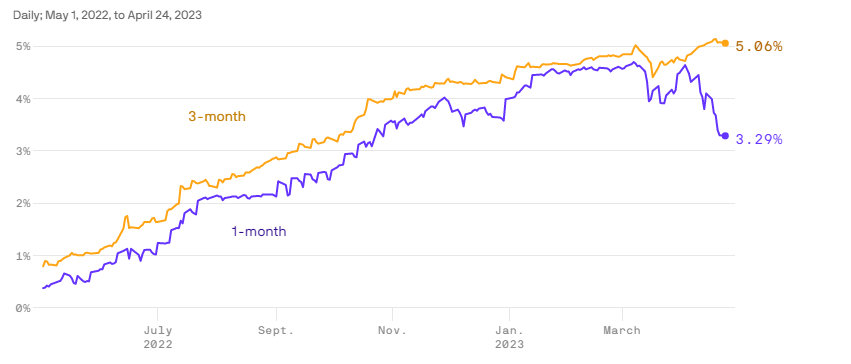
Strong demand for the one-month Treasury bill sent prices higher and the yield down to 3.29% from 4.675% at the end of March. Meanwhile, three-month Treasury bills yield 5.06%, a record high.
Bringing this data together, the 3-month Treasury bill yields 1.77% above the one-month equivalent – the largest gap on record.
This tells us that Investors are piling into ultra-short-term one-month Treasury bills to avoid being caught up in the debt ceiling drama. The 3-month treasury yield has risen over recent weeks because three months from now would be in the middle of a potential debt ceiling default.
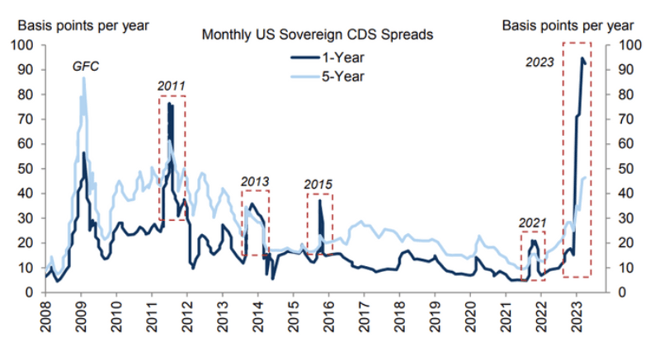
CDS
Aside from the treasury market, there are other signs of concern. The one-year credit default swap, which reflects the price of insuring against a US government default, rose to 106 basis points, its highest level since 2008, up 15 basis points from the start of the year and well above 2011 levels.
It is worth highlighting that the market for one-year swaps is relatively illiquid. CDS for creditworthy countries typically trade between 25 to 50 basis points.
 Source: Goldman Sachs research
What does it mean for stocks?
So far, the stock market is not fully engaging with the prospect of a default. Earnings season is in full swing and is doing well to distract the equity market away from the political theatre in Washington.
That said, a pocket of the stock market reflects the debt ceiling crisis. Stocks with greater exposure to government spending show more signs of pricing in the debt limit risk.
Goldman Sachs’s basket of US stocks with at least 20% of sales tied to government spending have lagged behind the broader market by almost 10% this year. This could be interpreted as a reflection of the market pricing in potential spending caps as part of any debt ceiling compromise.
Chart showing stocks exposed to government spending underperform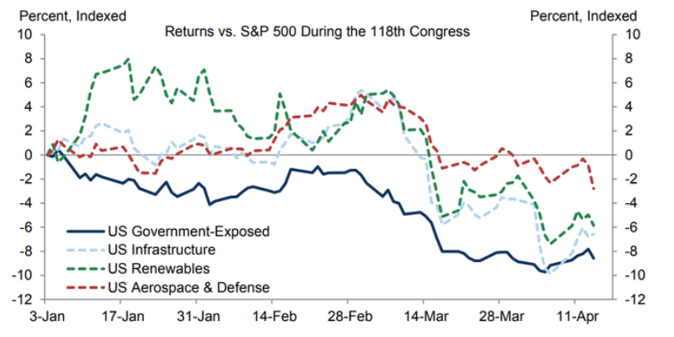
Source: Goldman Sachs research
Should the debt ceiling impasse continue, the risk of default and the associated economic hit rises as we move closer to the X-date. This will start to weigh more heavily on risk sentiment and drag riskier assets, such as stocks, lower.
Summary
Congress is locked in an impasse over raising the £31.4 trillion debt ceiling. Failure to reach an agreement could see the US Federal government default on its debt obligations with potentially catastrophic repercussions for the US economy.
The spread between the one-month and three-month treasury yields has widened to a record level as the treasury market sounds alarm bells. Meanwhile, stocks closely tied to government spending have been lagging behind the S&P 500. The closer negotiations move towards the X-date without an agreement, the larger the expected hit to risk sentiment. This could fuel a selloff in risk assets such as stocks.

