The Basics of Candlestick Components sets the foundational understanding of the different elements of a candlestick chart, a popular tool used by traders. This guide explores the Types of Reversal Patterns, which can signal potential opportunities for traders to profit from market reversals. It provides a detailed explanation on the Interpretation of Common Reversal Candlestick Patterns, focusing on how traders can identify and understand these patterns to make informed trading decisions. The section on Bearish Patterns and How to Spot a Bearish Reversal offers insights into identifying potential downtrends in the market, crucial for minimizing losses. In-depth focus is given to specific patterns such as the Doji Candlestick Pattern, The Hammer and Hanging Man Patterns, and The Engulfing Candlestick Pattern, each offering unique insights into market sentiments. Understanding how to use these patterns within the broader context of Technical Analysis is crucial for effective trading. The guide also highlights Common Mistakes to Avoid when interpreting these patterns, ensuring traders avoid costly errors. Finally, the Advantages and Limitations of Candlestick Patterns are discussed, enabling traders to leverage the benefits while being aware of the potential drawbacks. This introduction to candlestick patterns is designed to be a comprehensive guide for anyone looking to enhance their trading strategies in the forex market.
Contents: Candlestick pattern
- How do you read a candlestick chart?
- Basics of Candlestick Components
- What is a reversal pattern?
- What is a reversal candlestick pattern?
- Types of Reversal Patterns
- What is the strongest candlestick pattern?
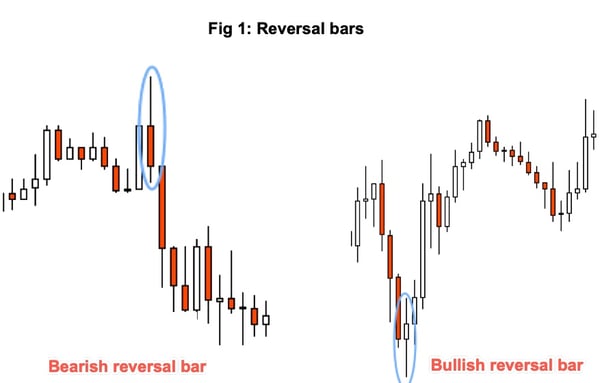
- What do reversal candles look like?
- Interpretation of Common Reversal Candlestick Patterns
- Bullish patterns
- How do you spot a bullish reversal?
- Bearish Patterns
- How do you spot a bearish reversal?
- Understanding the Doji Candlestick Pattern
- The Hammer and Hanging Man Patterns
- The Engulfing Candlestick Pattern
- Using Candlestick Patterns in Technical Analysis
- Common mistakes to avoid while interpreting candlestick patterns
- How to Trade with Candlestick Patterns
- Advantages and Limitations of Candlestick Patterns
-------------------------------------
How do you read a candlestick chart?
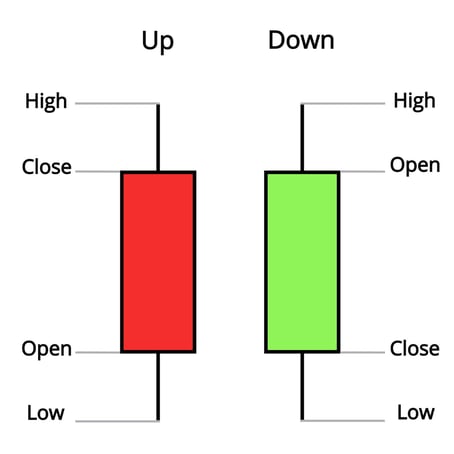
Candlestick charts are graphical way of representing the open, close, high and low of the price of a market over a given period of time developed in Japan.
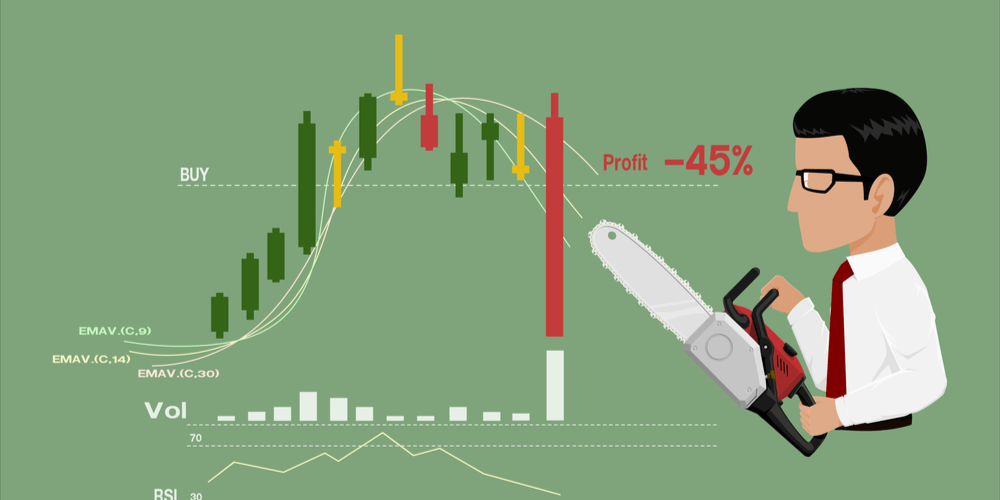
Candlestick reversal patterns are one of the most commonly used technical trading signals in futures and forex trading. While they do not represent a magic bullet to becoming a millionaire trader, over time candlestick reversal indications have been found to be a reliable indicator of trend change.
Basics of Candlestick Components
Candlestick charts are a type of financial chart used to represent price movements in trading. A candlestick consists of four main components: the open, close, high, and low. The body of the candlestick represents the range between the open and close prices, while the wicks or shadows represent the high and low ranges. If the close price is higher than the open price, the body is typically filled (bullish), and if the open price is higher than the close price, the body is typically empty (bearish).
History of Japanese Candlestick charts
Candlestick charting, originating in Japan over 300 years ago, only became popular in the Western world in the last half century. Steve Nison, author of ‘Japanese Candlestick Charting Techniques’ is widely credited as the pioneer of candlestick charting, who really helped popularise them alongside the rise of online brokers. Now candlestick charting has largely replaced bar charting as the technical trader’s tool of choice.
Advantages of candlestick charts
Better Visuals: The major advantage that candlestick charting offers is that the candlestick representing whatever given time frame (hourly, 4-hour, daily, etc.) provides a much clearer visual representation of the relationship between the opening and closing prices of the time period – i.e. whether price ultimately closed higher or lower for the period.
Recognizable patterns: Candles make it easier for traders to see the most important aspects of the trading action for each period. Candlestick charting also offers a further advantage by virtue of the fact that there are clearly defined candlestick patterns recognised as signals of potential market trend reversal.
What is a reversal pattern?
There are two main types of reversal pattern. The first is a classic charting pattern reversal like a double bottom or Head and Shoulders top. The second is a Japanese candlestick reversal pattern, typically made up of two to three candles on a candlestick chart. Today we are talking about the latter.
What is a reversal candlestick pattern?
The purpose of a reversal candlestick pattern is to give a signal that the short-term direction of the market, over the next several periods is changing. This is as opposed to a continuation candlestick pattern that signals the trend is likely to continue in the same direction.
The “message” of technical analysts take from a reversal pattern is that momentum has been exhausted and is now moving in the opposite direction.
Bullish reversal pattern
This is a signal that a price which is going lower is turning higher.
Bearish candlestick reversal
This is a signal that a price which is going higher is turning lower.
5 Best Candlestick reversal patterns
What do reversal Candles look like? What is the strongest candlestick pattern? We will show you which we think are the most important candlestock reversal patterns.
1) The Hammer
One of the most widely recognised candlestick reversal patterns is the pin bar – because it looks like a pin. You can see it here:
In Japanese candlestick terms, the pin bar is also referred to as the hammer pattern when it occurs in a bearish trend, signalling a possible bullish market reversal, and as the 'shooting star' pattern when it occurs in an uptrend, signalling a potential reversal to the downside.
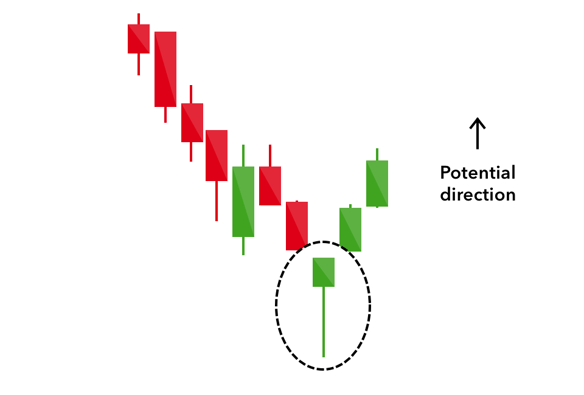
The above image shows a hammer that indicates a potential market reversal from downtrend to uptrend.
The key element of the pin bar is the elongated tail. The long tail is formed by bears aggressively pushing price significantly lower during the time period – but the fact that the closing price is back up near the opening price indicates that the attempt to push price lower was ultimately strongly rejected. The initial drop in price is followed by a stronger move to the upside that brings price back near, or even above, the opening price.
Hammer pattern trading strategy
When the hammer pattern is an accurate indication of trend reversal, price does not usually subsequently go any lower than the low of the pin bar candlestick. Therefore, the typical strategy is as follows:
Entry: At market open after hammer candlestick has closed
Stop loss: Underneath the low of the hammer candlestick
Take Profit: Risk: Reward ratio of 2:1
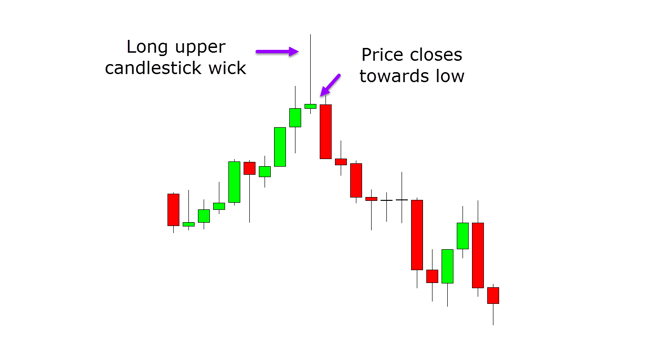
2) Shooting Star
The shooting star pattern – which indicates a potential market reversal to the downside – is simply the hammer pattern turned upside down. There is a long tail on the topside of the candlestick body, which represents a failed attempt to push price higher, rather than on the bottom side of the body as is the case with the hammer pattern.
3) Bullish Engulfing Candlestick
Engulfing candlesticks are another candlestick pattern that indicate a possible market reversal.
A bullish engulfing candlestick, indicating a possible reversal to the upside, is one where the body of an up candlestick (one where the close is higher than the open) completely encompasses the body of the immediately previous down candlestick.
The 30-minute chart of GBP/USD below shows a large bullish engulfing candlestick six candlesticks in from the left-hand side of the chart, that occurs on April 12th – after which the market did move strongly to the upside.
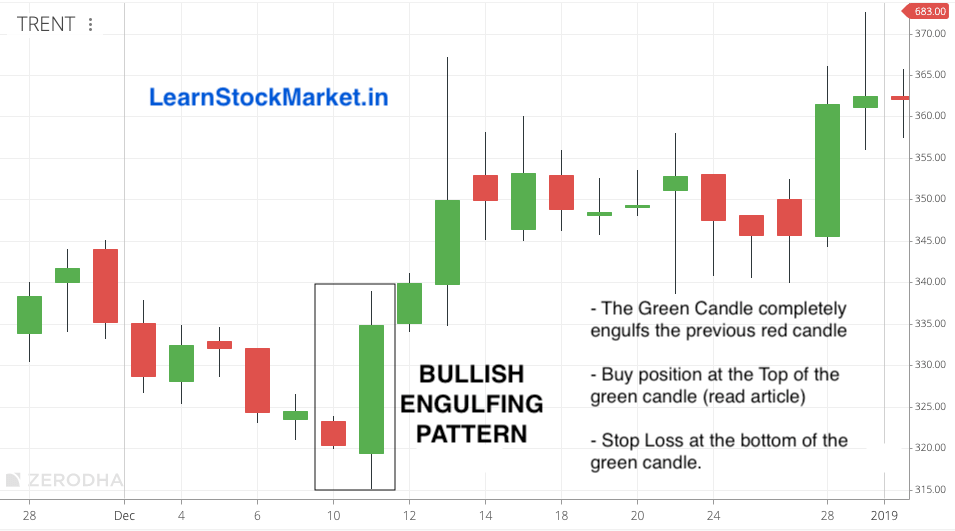
Bullish engulfing candlestick trading strategy
When the bullish engulfing pattern is an accurate indication of trend reversal, price does not usually subsequently go any lower than the low of the second bullish candlestick. Therefore, the typical strategy is as follows:
Entry: At market open after second engulfing candlestick has closed
Stop loss: Underneath the low of the second engulfing candlestick
Take Profit: Risk: Reward ratio of 2:1
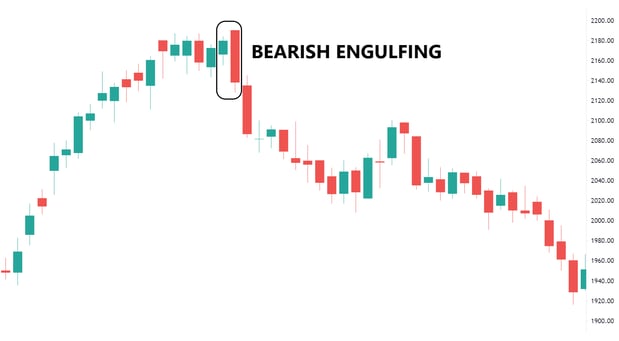
4) Bearish Engulfing Candlestick
A bearish engulfing candlestick signals the possible end of an uptrend. It is where a bearish down (normally red or black) candle completely encompasses the previous up candlestick (normally green or white).
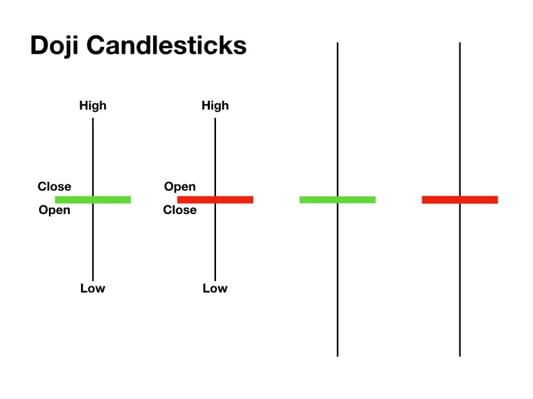
5) The Doji candlestick pattern
A doji candlestick is formed when the opening and closing price of a candlestick are identical, so that the candlestick has essentially no body, only upside and downside tails that extend on either side of the opening/closing price. This is what a doji candlestick looks like.
The common interpretation of the doji pattern is that it indicates indecision in the market. Price moves both higher and lower, but ultimately settles right back where it began.
Indecision in a market often precedes a trend change, and that’s why the doji pattern is often considered an indicator of possible trend change, although not as strong an indicator as the pin bar or engulfing candlestick patterns.
Doji candlestick pattern trading strategy
If a Doji pattern happens at the end of an over-stretched trend, it can be a good signal that a top or bottom is close. If the doji pattern happens near the beginning of a strong trend, it can act as a second chance to enter in the direction of the existing trend.
Entry: Buy Stop order above the high of the doji or Sell stop order under the low of the doji
Stop loss: Placed at the opposite side of the doji to the entry stop order
Take Profit: Risk: reward 2:1
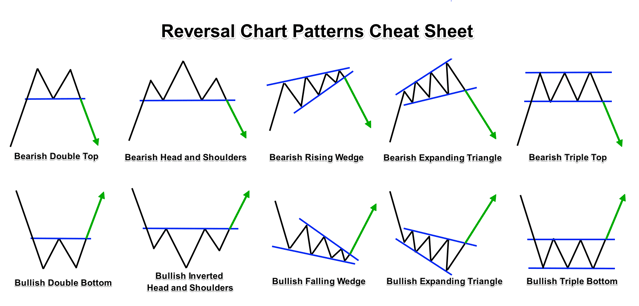
Types of Reversal Patterns
Reversal patterns in candlestick charts signal a potential change in price direction. They are divided into two main types: bullish and bearish reversal patterns.
- Bullish Reversal Patterns: Indicate a potential change from a downtrend to an uptrend. Examples include hammer, inverse head and shoulders, and double bottom patterns.
- Bearish Reversal Patterns: Suggest a potential shift from an uptrend to a downtrend. Examples include shooting star, head and shoulders, and double top patterns.
Interpretation of Common Reversal Candlestick Patterns
Interpreting candlestick patterns requires understanding the context of the pattern within the larger market trends. For instance, a hammer pattern in a downtrend indicates a potential bullish reversal, while a shooting star in an uptrend signals a potential bearish reversal. Traders use these patterns along with other technical analysis tools to confirm potential trend shifts.
Bearish Patterns
Bearish patterns signal potential downtrends in the market. Key bearish patterns include:
- Shooting Star: A type of bearish reversal pattern that forms after an uptrend. It consists of a small body with a long upper shadow and little to no lower shadow.
- Bearish Engulfing Pattern: This pattern occurs when a small bullish candle is followed by a large bearish candle that completely engulfs the previous candle.
- Dark Cloud Cover: A two-candle bearish reversal pattern where a large bullish candle is followed by a bearish candle that opens above the previous candle's high but closes below its midpoint.
How do you spot a bearish reversal?
A bearish reversal indicates a potential shift from an uptrend to a downtrend in the market. Traders typically spot a bearish reversal through several insightful methods:
- Identifying Reversal Patterns: This involves recognizing specific bearish candlestick patterns, like the Bearish Engulfing Pattern, Shooting Star, or Doji.
- Using Technical Analysis Tools: Traders use trend lines, moving averages, or technical indicators like the Relative Strength Index (RSI), to spot potential reversals.
- Volume Analysis: A significant increase in trading volume can often precede a bearish reversal.
Understanding the Doji Candlestick Pattern
The Doji candlestick pattern is characterised by a small or non-existent body with long shadows on both ends. This pattern indicates that both buyers and sellers exerted the same level of pressure during the trading period, resulting in a near-equal opening and closing price. This pattern often signifies indecision in the market and can potentially signal an upcoming price reversal.
The Hammer and Hanging Man Patterns
The Hammer and Hanging Man patterns are important candlestick patterns that signal potential price reversals. The Hammer pattern forms during a downtrend and signals a potential bullish reversal. Conversely, the Hanging Man pattern forms during an uptrend and indicates a potential bearish reversal. Both patterns have small bodies, little or no upper shadow, and a long lower shadow. The key difference is their position in a trend.
The Engulfing Candlestick Pattern
The Engulfing candlestick pattern consists of two candles. In a Bearish Engulfing pattern, a smaller bullish candle is followed by a larger bearish candle that 'engulfs' the previous one, indicating a possible bearish reversal. Conversely, a Bullish Engulfing pattern signifies a possible bullish reversal.
Using Candlestick Patterns in Technical Analysis
Candlestick patterns serve as valuable input for technical analysis. They provide insights into market sentiment and potential price reversals. However, they should not be used in isolation. Combining them with other technical analysis tools such as trendlines, resistance and support levels, and technical indicators can provide more reliable trading signals.
Common mistakes to avoid while interpreting candlestick patterns
- Ignoring the Market Context: It's crucial to consider the broader market trend and context before making a decision based on a single candlestick pattern.
- Over-reliance on Single Patterns: Traders should avoid basing their trading decisions solely on a single pattern. Confirmation from other indicators or patterns should also be considered.
- Disregarding Volume: Volume can provide critical information about the strength of a pattern. Ignoring it can lead to false signals.
How to Trade with Candlestick Patterns
Trading with candlestick patterns involves the following steps:
- Understanding Various Patterns: Familiarise yourself with different candlestick patterns and what they signify.
- Identifying Patterns on the Chart: Spot these patterns on the price chart in real-time.
- Confirming the Pattern: Use other technical analysis tools to confirm the pattern's indication.
- Executing the Trade: Based on the confirmation, plan and execute your trade.
Advantages and Limitations of Candlestick Patterns
Candlestick patterns provide visual insights into market sentiment and potential reversals, making them a valuable tool for traders. However, they also come with limitations. They are subjective and can often provide false signals. Hence, it's advisable to use them in conjunction with other technical analysis tools for more reliable outcomes.
Candlestick patterns Conclusion
Candlestick reversal patterns can be key technical indicators of a possible trend change, either from uptrend to downtrend, or vice-versa. When such reversal patterns occur, traders look to other technical indicators – such as moving averages, pivot points, and volume – for confirming indications of a market reversal.