Implied volatility – a gauge of market risk – in China’s currency showed extreme risk around the US presidential election. It can be used to make forecasts.
Definition: What is implied volatility (IV)?
Implied volatility shows the market view about the probability of changes in a market price. It is used to price options contracts and with it, investors can make projections about future price moves.
Implied volatility is direction-neutral but rising IV typically happens when falling prices are expected while falling IV happens when the price of a market is expected to rise.
IV is expressed using the symbol σ (sigma) and is expressed as a percentage over a specific time period. It is calculated using an options pricing model like Black-Scholes – a favourite of any economic graduate!
Reminder: An options contract is a derivative that gives investors the right but not the obligation to buy or sell a security at a given price.
High Implied Volatility Example (2020 US election)
1-week implied volatility in the Chinese yuan ripped to the highest since records began in 2011. That surpasses levels reached during the US China trade war and the Chinese stock market meltdown in 2015.
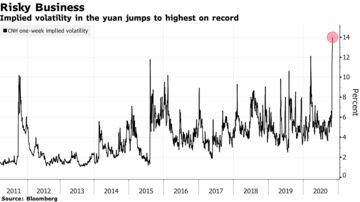
Higher levels of volatility don’t by themselves speak to the risks of a specific event. However, if IV rises over a specific time period when a big event is known to be happening – in this case the week of the US election – then you can construe that the market expects there is a higher probability of large price moves during that period.
When watching implied volatility as an indicator to decide a potential trade, the clearest signals are when it is at an extreme. An all-time high reading of course would of course count as an extreme that gives the signal extra strength.
Now if we look at the price of the Chinese yuan during the 2000 US Election Day and the hours afterwards, the high IV correctly predicted larger price swings than normal.
Price chart of dollar-yuan (USD/CNH) [November 3-4, 2020]
Implied volatility to forecast prices
You can calculate the probability of a certain move in the price of any market including forex, stocks, ETFs or commodities.
The information about a market you need is
- Forecast date
- Implied volatility
- Standard deviation
The implied volatility shows how far the stock price could change over one standard deviation (a formula we all learned in school that quantifies how much the members of a group differ from the mean value of the group). The SD for a market is available on many financial websites.
For example, a $10 stock with a 20% implied volatility has a 68 percent chance to be priced between $8 and $12 one year from now.
Divide the number of days until the stock price forecast by 365, and then find the square root of that number. Then, multiply the square root with the implied volatility percentage and the current stock price. The result is the change in price.
For example, a $10 stock with a 20 percent implied volatility that expires in six months (183 days) would have a 68% chance of rising or falling by $1.41.
Note of caution about implied volatility
IV is a useful tool but no one indicator can ever be used in isolation. Implied volatility can help foresee periods of high risk and help forecast potential prices ranges during those periods. However, it is calculate using past options price data and cannot predict future events nor can it incorporate future changes in market conditions.
Examples of markets with weekly options
- SPDR Gold Trust ETF (GLD)
- iShares MSCI Emerging Markets Index ETF(EEM)
- iShares Russell 2000 Index Fund (IWM)
- PowerShares QQQ (QQQQ)
- SPDR S&P 500 ETF (SPY)
What is an option?
Sources:
https://finance.zacks.com/use-implied-volatility-forecast-stock-price-8231.html