

The fundamental premise of this CFD trading strategy hinges on harnessing the power of Japanese candlestick patterns to pinpoint a price level that has been 'rejected' by the market. This strategy, also known as Rejection Candle Trading, is a crucial aspect of understanding price action in CFD trading.
It focuses on the intricate components of a rejection candle and emphasizes the significance of 'support' and 'resistance' levels. Comprehending these levels enables traders to discern potential turning points in the market, thereby providing invaluable insight into market sentiment. This strategy also provides guidance on how to trade effectively using rejection candles, underscoring the importance of risk management in CFD trading to mitigate potential losses.
Furthermore, it highlights common pitfalls traders often encounter and provides practical advice on how to steer clear of them. Delve deeper to arm yourself with this comprehensive strategy that will enhance your trading prowess and decision-making abilities in the dynamic world of CFD trading.
Contents: Price Action CFD Trading Strategy: Rejection Candles
- Definition of trading strategy
- Understanding Price Action CFD Trading
- How it looks
- Components of a Rejection Candle
- Where will rejections happen?
- Significance of Support and Resistance Levels
- Understanding Market Sentiment
- Good rejection candle examples
- Bad rejection candle examples
- How to Trade Using Rejection Candles
- Risk Management in CFD Trading
- Common Mistakes and How to Avoid Them
- Final takeaways
Definition of trading strategy
A ‘rejection candlestick’ communicates the rejection (or reversal from) higher or lower prices. Naturally, it is found when using Japanese candlestick charts. The candlestick shows that the market has pushed in one direction but then been rejected.
Understanding Price Action CFD Trading
In the realm of Contract for Difference (CFD) trading, price action refers to the movement of a security's price. Price action is often represented graphically on a chart and is a key tool for CFD traders to predict future price movements. It's crucial to understand the concept of price action and how it can be used to make informed trading decisions.
- Trend Analysis: Price action can help traders identify market trends. For instance, a series of higher highs and higher lows indicate an uptrend, while lower highs and lower lows suggest a downtrend.
- Price Patterns: Traders often look for specific price patterns, like double tops or double bottoms, which can suggest potential reversals.
- Supply and Demand: Price action can reveal areas of supply (resistance) and demand (support), which can act as key levels for trading.
How it looks
The ‘rejection candlestick’ looks exactly like a shooting star bearish reversal candlestick or the bullish hammer reversal candlestick pattern. It is also known as ‘pin bar’ pattern (short for Pinocchio!). The main characteristic is the long wick in contrast with a short body.
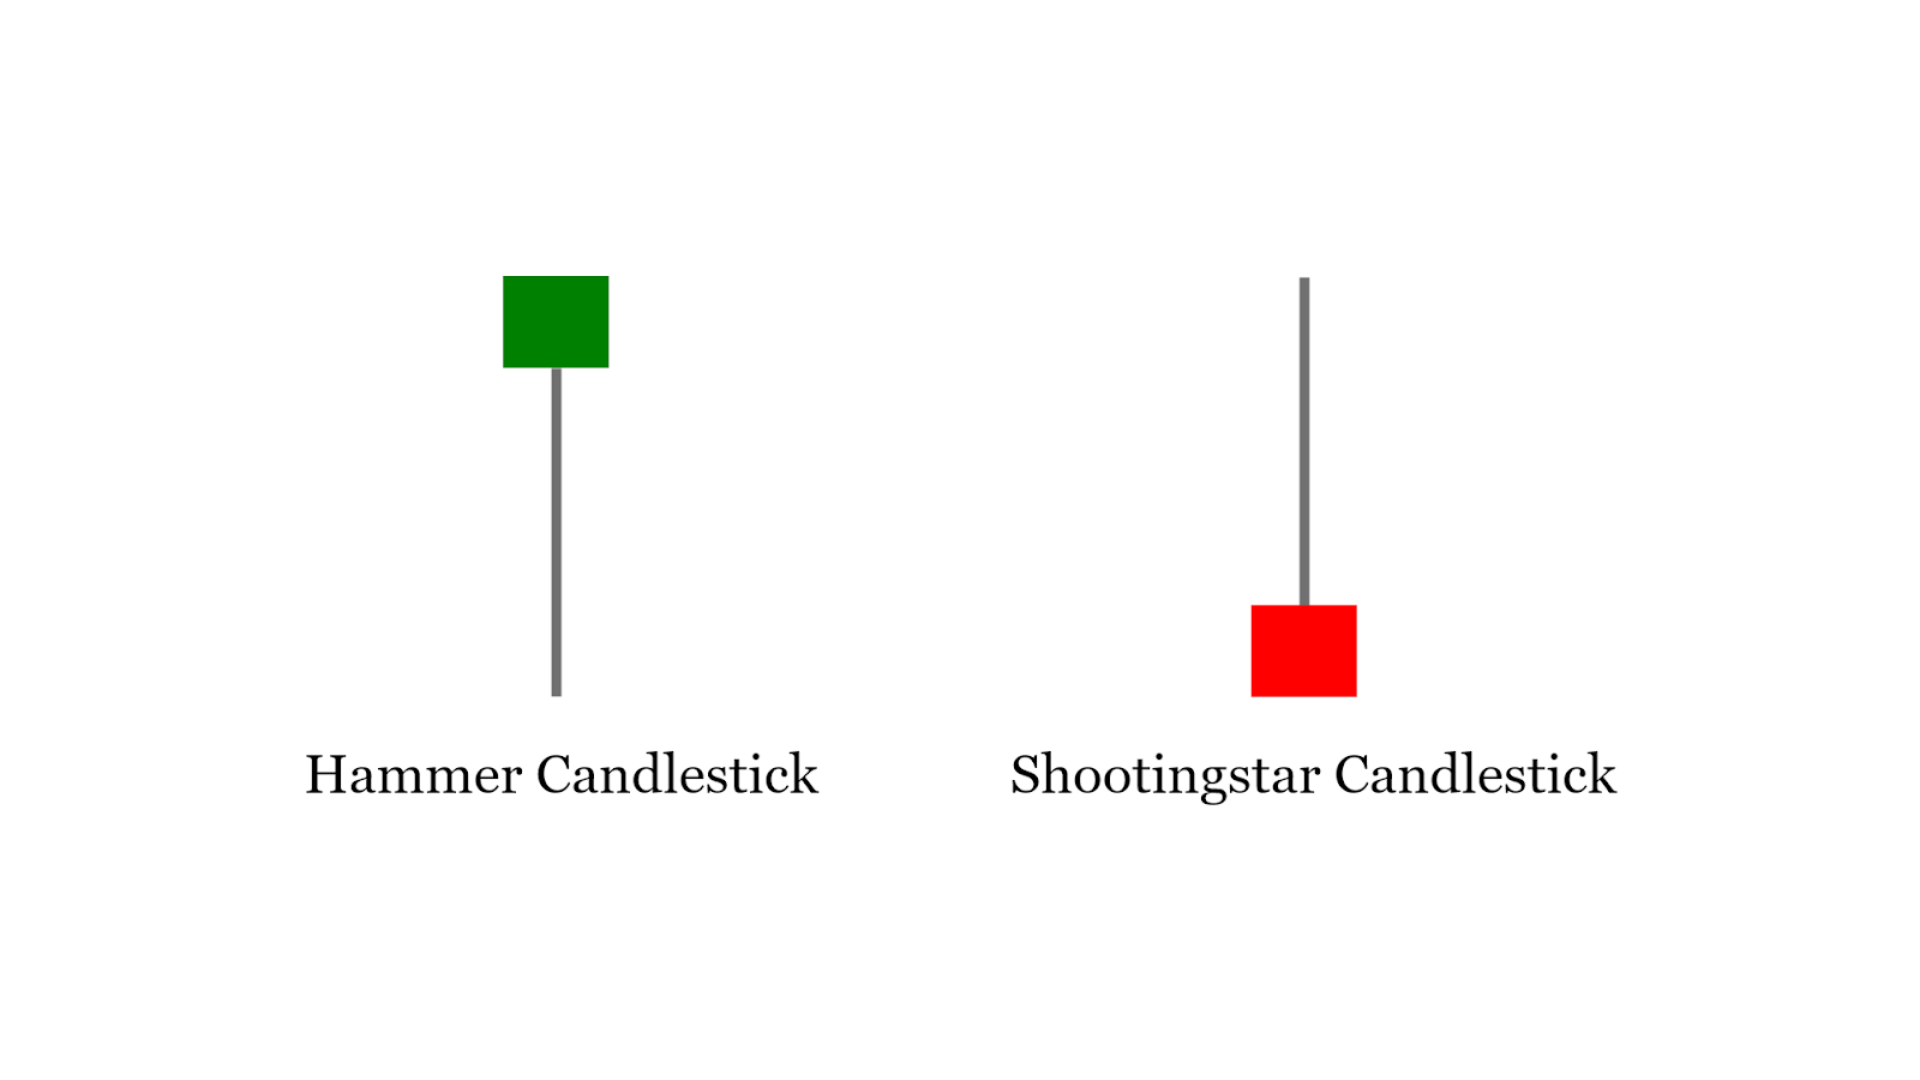
What distinguishes this strategy from the identical Japanese candlestick pattern is where it happens on the price chart. The rejection must take place at a significant high or low in the market.
Components of a Rejection Candle
A rejection candle is a crucial component of price action trading. It represents a scenario where the market attempted to move in a particular direction but was rejected.
- Open and Close: The candle’s open and close points tell us the initial and final prices during the candle formation. In a bullish rejection candle, the close is higher than the open.
- Wick: The wick, or shadow, of a candle represents the range between the highest and lowest prices during the candle formation. A long wick in the opposite direction of the trend indicates a strong rejection.
- Body: The body of the candle represents the range between the open and close prices. A large body suggests strong buying or selling pressure.
Where will rejections happen?
In this chart it can be seen that the evening star pattern happen at the previous high in the price. What it shows us is that bulls tried to take the market higher but bears took control and forced the price back down again.
The fact that it happened all within one timeframe (whatever timeframe the candle is) shows us that there has been rejection. The previous high in this case shows us that the rejection was of something significant – an attempt by the market to make a higher high - a characteristic of an uptrend.
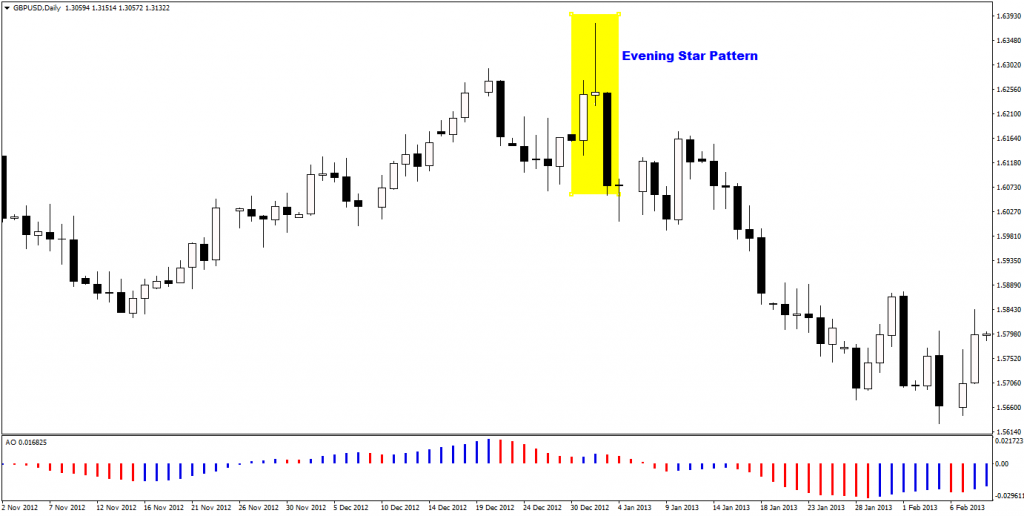
The point of the above chart is to show what is integral to this trading system. The rejection candle must occur at an area on the chart that is worth rejecting.
NOTE: A common mistake by newbie traders upon learning a candlestick pattern is to trade every candlestick pattern they see. A cursory glance at any price chart will quickly show that there are many ‘failed’ candlestick patterns. The point is this – the candlestick reversal pattern will only consistently work at important price levels.
This leads us to the next question. What is an ‘important’ price level?
The list below highlights six areas of the chart in which rejections should happen. So make sure the rejection you are considering as using as a trigger to enter a trade is at one of these areas on the chart in order to increase your overall probability of success.
- Round numbers
- Previous swing highs and lows
- Trendlines
- Popular moving averages (50DMA, 200DMA etc)
- Fibonacci retracement levels
- At the end of a very extended trend
There are other things like pivot points but this strategy is better as KISS (keep it simple stupid!)
Significance of Support and Resistance Levels
Support and resistance levels are crucial in understanding market sentiment and making trading decisions. These levels represent price points at which a stock typically does not move beyond.
- Support: A support level is a price level where the price tends to find "support" as it falls. This means the price is more likely to rebound from this level rather than break through it.
- Resistance: A resistance level is the opposite of a support level. It's where the price usually stops rising and may bounce back.
- Role Reversal: Once a resistance level is breached, it often becomes a new support level, and vice versa. This is known as the principle of role reversal.
Understanding Market Sentiment
Understanding market sentiment is crucial in making trading decisions. It refers to the overall attitude of investors toward a specific security or financial market. It is the tone of a market, or its crowd psychology, as revealed through the activity and price movement of the securities traded in that market.
Market sentiment is typically considered as being bullish when prices are expected to rise, or bearish when prices are expected to fall. It can be influenced by a variety of factors such as economic indicators, natural disasters, political instability, and many more.
- Sentiment Indicators: These include polling data, volatility indices, and put/call ratios, which can give a general idea of the market’s mood.
- News and Economic Events: Major news events and economic data releases can shift market sentiment rapidly.
- Price Action: Price action can provide clues about market sentiment. For example, a rejection candle at a key resistance level may indicate bearish sentiment.
Good rejection candle examples
The below chart has been picked at random to give some indication as to how this strategy can be employed, giving examples of each of the above price areas.
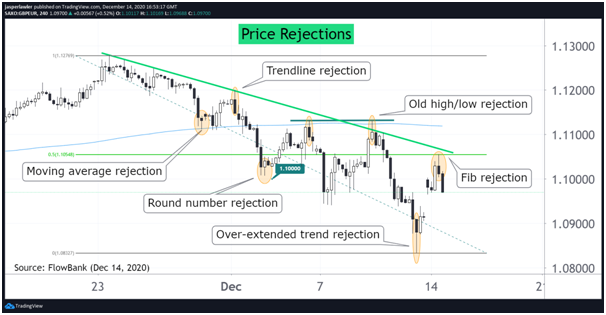
Let's run through the price action ---
- Two consecutive long wicks reject price moving below the 200-day moving average and after some consolidation the price moves higher.
- The up-move gets rejected by the 4th touch of a falling trendline and price is send significantly lower to just above the 1.10 round number,
- where lower prices are rejected and sent back higher again to the moving average, which this time acts as resistance instead of support.
- The price falls but eventually makes its way back up to the old high where the up-move is rejected and price is sent back down in another large down-leg, which gets very over-extended,
- which eventually creates a rejection of lower prices and sends the price back higher. The resulting up-move
Bad rejection candle examples
No trading strategy works perfectly – and that’s without consideration of important ingredients to trading including risk management and trader psychology. But there are some rules of thumb to increase the probability of each trade by avoiding some common pitfalls.
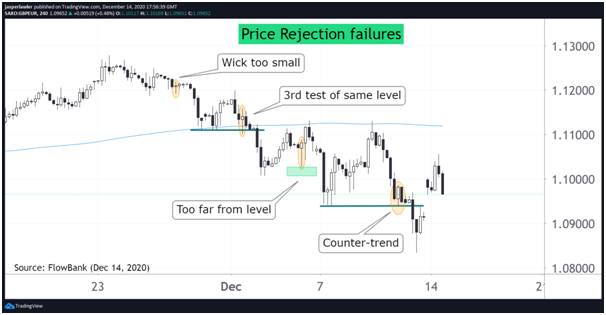
When looking at good examples, we focused on finding ‘important areas’ on the price chart in which to take the rejection signals. In the bad examples, we are focusing on some reasons that might increase the probability that the patterns fail in order to decide which rejections to ignore.
These are four rules of thumb for which rejections to ignore:
- The rejection is against the dominant trend
- The rejection happens at a level that has recently been rejected
- The wick of the candle is too small to be significant
- The rejection happens too far away from important areas on the chart
By ignoring trades that meet one of the four previously listed criteria, we can filter out the ‘bad trades’. It’s no mistake that top of the list is going against the trend. Counter-trend trading is very difficult and typically something that should only be attempted by advanced traders with a very fine-tuned system with very well-defined risk: reward criteria for when to take such trades. The other three are really about the 'quality' of the setup in which the rejection is happening. Taking only the highest quality setups means fewer trades but greatly improves the win:loss ratio of the trading system.
How to Trade Using Rejection Candles
Rejection candles, also known as pin bars, are a type of candlestick pattern that signal a potential reversal in the market trend. They are characterized by a small body and a long wick, indicating that the market rejected higher or lower prices.
Trading using rejection candles involves identifying these patterns and then entering a trade based on the expected reversal. For a bullish rejection candle, you might consider entering a 'buy' trade after the candle closes, with a stop loss below the low of the candle. For a bearish rejection candle, you might consider entering a 'sell' trade with a stop loss above the high of the candle.
Risk Management in CFD Trading
Risk management is a critical aspect of CFD (Contract for Difference) trading. Some risk management techniques include:
- Position sizing: This involves deciding how much to invest in a particular trade, often based on the amount of money you're willing to risk.
- Setting stop losses: This allows you to limit your losses if the market moves against your position.
- Diversifying your portfolio: This can help spread risk across a variety of investments instead of relying on the performance of a single asset.
By employing these strategies, traders can protect their capital and potentially improve their trading performance.
Common Mistakes and How to Avoid Them
Despite the potential profits, CFD trading also comes with its fair share of risks. Here are some common mistakes that traders make and how to avoid them:
- Not having a trading plan: A trading plan is essential as it outlines your financial goals, risk tolerance, and trading strategies. Without it, you're essentially gambling.
- Overleveraging: While leverage can magnify profits, it can also amplify losses. It's important to understand how leverage works and use it judiciously.
- Ignoring risk management: As mentioned earlier, risk management is crucial in trading. Ignoring it can lead to significant losses.
Final takeaways
- Understand what the candlestick pattern looks like
- Only take the very best shaped candles
- Enter trades following rejections from the listed ‘important area’
- Filter out bad trades with the 4 rules of thumb
- Compliment this trading strategy with risk management and psychology techniques

