

First quarter earnings season for US companies has just ended. What are the main lessons to be learned for the coming quarters?
US companies: Q1 results
With 97% of U.S. companies having reported their Q1 earnings, aggregate S&P 500 earnings per share are expected to rise by 50% from Q1 2020. This is the largest increase since the first quarter of 2010.
Note that these results far exceeded consensus expectations, which banked on a 27% increase. In fact, 76% of companies beat expectations for revenue and 86% exceeded analysts' expectations for earnings. According to FactSet, this is the best score since 2008.
In terms of second-quarter guidance, 33 S&P 500 companies lowered their forecasts while 54 raised them.
These strong results generally prompted sell-side analysts to adjust their forecasts upward for the rest of the year. The consensus is now for earnings growth of 34% for the full year 2021. The forecast was "only" banking on 22% at the beginning of the year.
Unlike the previous three quarters when better-than-expected results were mainly due to low expectations, the strong earnings growth in the first quarter reflects the strength of the economic recovery. Business demand is picking up at a steady pace as the pace of vaccinations accelerates and pandemic restrictions are gradually lifted. On the consumer side, significant savings have been accumulated and could be quickly deployed once activity normalizes.
Revenues/margins
As mentioned above, revenues significantly exceeded expectations on average, but it is primarily the improvement in profit margins that explains this record quarter. The largest contribution to the improvement in operating margins came from financials, materials, and consumer cyclicals (mainly automobiles).
The increase in revenues due to the recovery in demand obviously had a positive impact on the operating leverage of many companies. Other factors that have had a beneficial effect on net margins include a weaker dollar, lower interest costs, far fewer bankruptcies than banks were anticipating, and productivity gains from increased technology adoption and deferred hiring.
The shortage of certain materials has not impacted short-term profitability. Indeed, companies seem able to pass on these cost increases to consumers. In the past, periods of rising prices have been quite favourable to profit margins. However, a sustained rise in inflation could result in higher interest rates and wages, with negative consequences for margins.
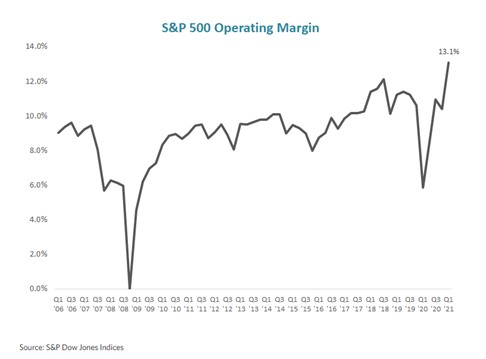 Operating margin of S&P 500 companies (source: Edward Jones, Factset)
Sector hierarchy
So-called "growth" stocks (e.g. technology sector) continue to post exceptional results, even though they had already benefited in part from the pandemic. However, the biggest positive surprises this earnings season have come from the value and cyclical sectors. The technology, energy and financial sectors dominated the sector ranking (see chart below).
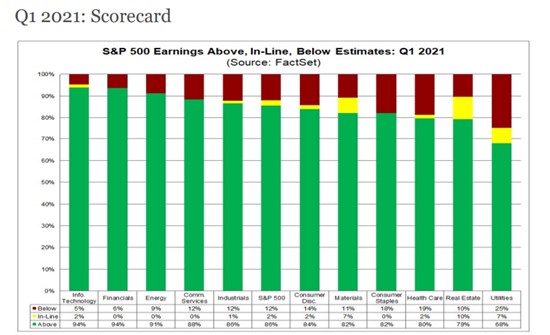
Percentage of companies reporting results above, below or in line with expectations - by sector (source: Factset)
Domestic vs. international exposure
Another point of interest is that while the economic recovery is not quite synchronized – with some countries still under significant restrictions – international exposure has not penalized results, quite the contrary. For example, companies with more than 50% of their revenues generated in the United States saw their revenues increase by 8.9%, while those generating more than 50% of their revenues internationally recorded a 16.2% increase in revenues. An important clarification: exposure to the Asia-Pacific region was the most beneficial at the expense of Europe.
Valuation
This earnings growth and upward revision of expectations means that the S&P 500 performance is roughly in line with earnings growth. However, even after these very good results, the 12-month price/earnings multiple is 22 times, well above the 10-year average of 16 times.
The P/E of the S&P 500 has, however, fallen slightly from the beginning of the year, a trend that could continue if earnings continue to grow faster than the index. Is there still significant upside potential for earnings per share? With the economic recovery underway, expected 12-month corporate earnings have already surpassed the pre-pandemic level by +11%, suggesting that the potential is limited. But as the chart below shows, following the last two recessions, corporate profits have continued to grow by an average of 65% after exceeding their pre-crisis level. It is therefore conceivable that earnings will continue to grow for some time.
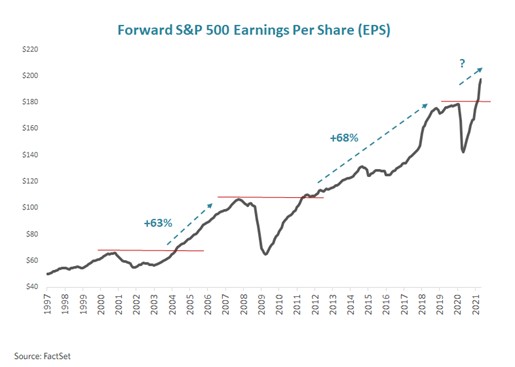
12-month earnings expectations for S&P 500 companies (source: Factset)
However, while S&P 500 earnings have the potential to grow by double digits over the next three quarters, the percentage increase could peak as early as the second quarter. This will be a deceleration in growth in line with the economic environment.
It should be noted, however, that analysts' expectations are relatively high. For the full year 2021, the consensus expectation is for the strongest earnings growth in 25 years: +56% (year-on-year) in Q2, +19% in Q3 and +16% in Q4 (source: Factset). These expectations create a risk for the markets if one or two quarters turn out to be less buoyant than expected. It should also be borne in mind that the estimates for 2022 do not take into account possible corporate tax increases, which could reduce profits by between 4% and 9%. So, there is also a risk of disappointment on expected earnings in 2022.
Better earnings growth potential in non-US stocks?
The business cycle in Japan and Europe lags that of the US for two reasons. First, the vaccine rollout started late. Second, the fiscal stimulus packages were not as generous as in the US. This lag has had an impact on the results of companies in different regions of the world. As mentioned above, earnings in the US are now exceeding pre-pandemic levels. In Europe, they are still 4% below January 2020 levels.
But this also suggests a potential for international markets to catch up with the US market. And the first quarter results could be the start of a trend. Non-US companies' earnings growth was 20% higher than that of US companies. This is the first relative outperformance in 12 quarters. There are two explanations for this phenomenon: easier comparisons (non-US earnings had fallen more last year) and a more cyclically sensitive sector composition of international developed indices than in the US due to a greater representation of cyclical sectors. This trend may coincide with stock market performance as international large-cap stocks outperformed U.S. large-caps during the month of May for the first time this year.
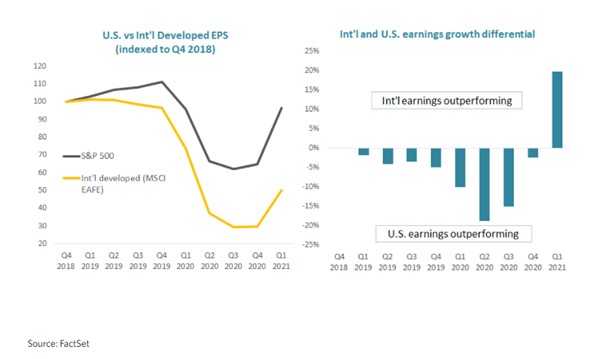
International and U.S. earnings growth difference (source: Edward Jones & FactSet)
Conclusion
At 22 times expected earnings for the next 12 months, the P/E of the S&P 500 is well above its historical average (16x). However, the market is already slightly cheaper than it was at the beginning of the year and the multiple should continue to decline as earnings recover. With earnings growth expectations of around 34% in 2021, multiples should continue to normalize without jeopardizing the outlook for stock market gains – although we should expect a more moderate increase than in 2020. It should also be noted that periods of earnings acceleration have often coincided with outperformance by cyclical and value stocks, which are more closely linked to economic dynamics than growth stocks.


