

The recent volatility in financial markets took major indices into correction levels, and even traditional safe havens such as Treasuries and gold offered limited protection. As uncertainty remains surrounding central banks actions, some worry that there might be more downside risk. In this environment, is there a place to hide?
For the past two years, investors who tracked the general stock market saw their portfolios gain fantastic returns, in large part thanks large fiscal and monetary stimulus. Price appreciation was ubiquitous across different asset classes, sectors, and regions. Today, however, as major central banks are normalising policy, i.e., removing liquidity, markets are suffering – and proving very volatile. Most importantly, the positive correlation between many holdings is something investors did not worry about in the recent past.
One way to navigate the current market is to look for investment opportunities that are “robust”, ideally “anti-fragile”, as described by Professor Nicolas Nassim Taleb. Robust means the stock (business) survives the crisis with little damage, while antifragile implies it benefits from the rising volatility (uncertainty in the market). This doesn’t necessarily mean these businesses that are robust or antifragile will not be impacted by periods of stress. While they will get dragged down by the market as periods of illiquidity create distortion in prices in the short term, they tend to recover quicker than fragile stocks. Let’s now consider a few of these investment strategies.
Diversification principle
A positive correlation is a relationship between two variables that move in tandem. Some believe holding multiple assets in their portfolio helps them to diversify the idiosyncratic risk of their portfolio. Although this is true for a portfolio containing securities that have no (or negative) cross-asset correlation, this is certainly not true for a portfolio of stocks that has significant exposure to a single asset class and/or sector. In general, there’s a small number of investors that have optimal diversification level in their portfolios, and that is because finding stocks that allow optimal diversification is difficult and very often costly.
Bonds are good candidates for diversification purposes and for that reason they’re widely used. In theory, given their safe character, bonds should perform well when equities do not, suggesting negative correlation. In reality, that relationship appears to be variable. In fact, the correlation between two assets can vary over time. The chart below displays the correlation between the 10-year US Treasuries and the US stock market (S&P500) on a 60-days rolling basis. Treasuries worked better as a diversifier in the early 2000’s than for the past 10 years.
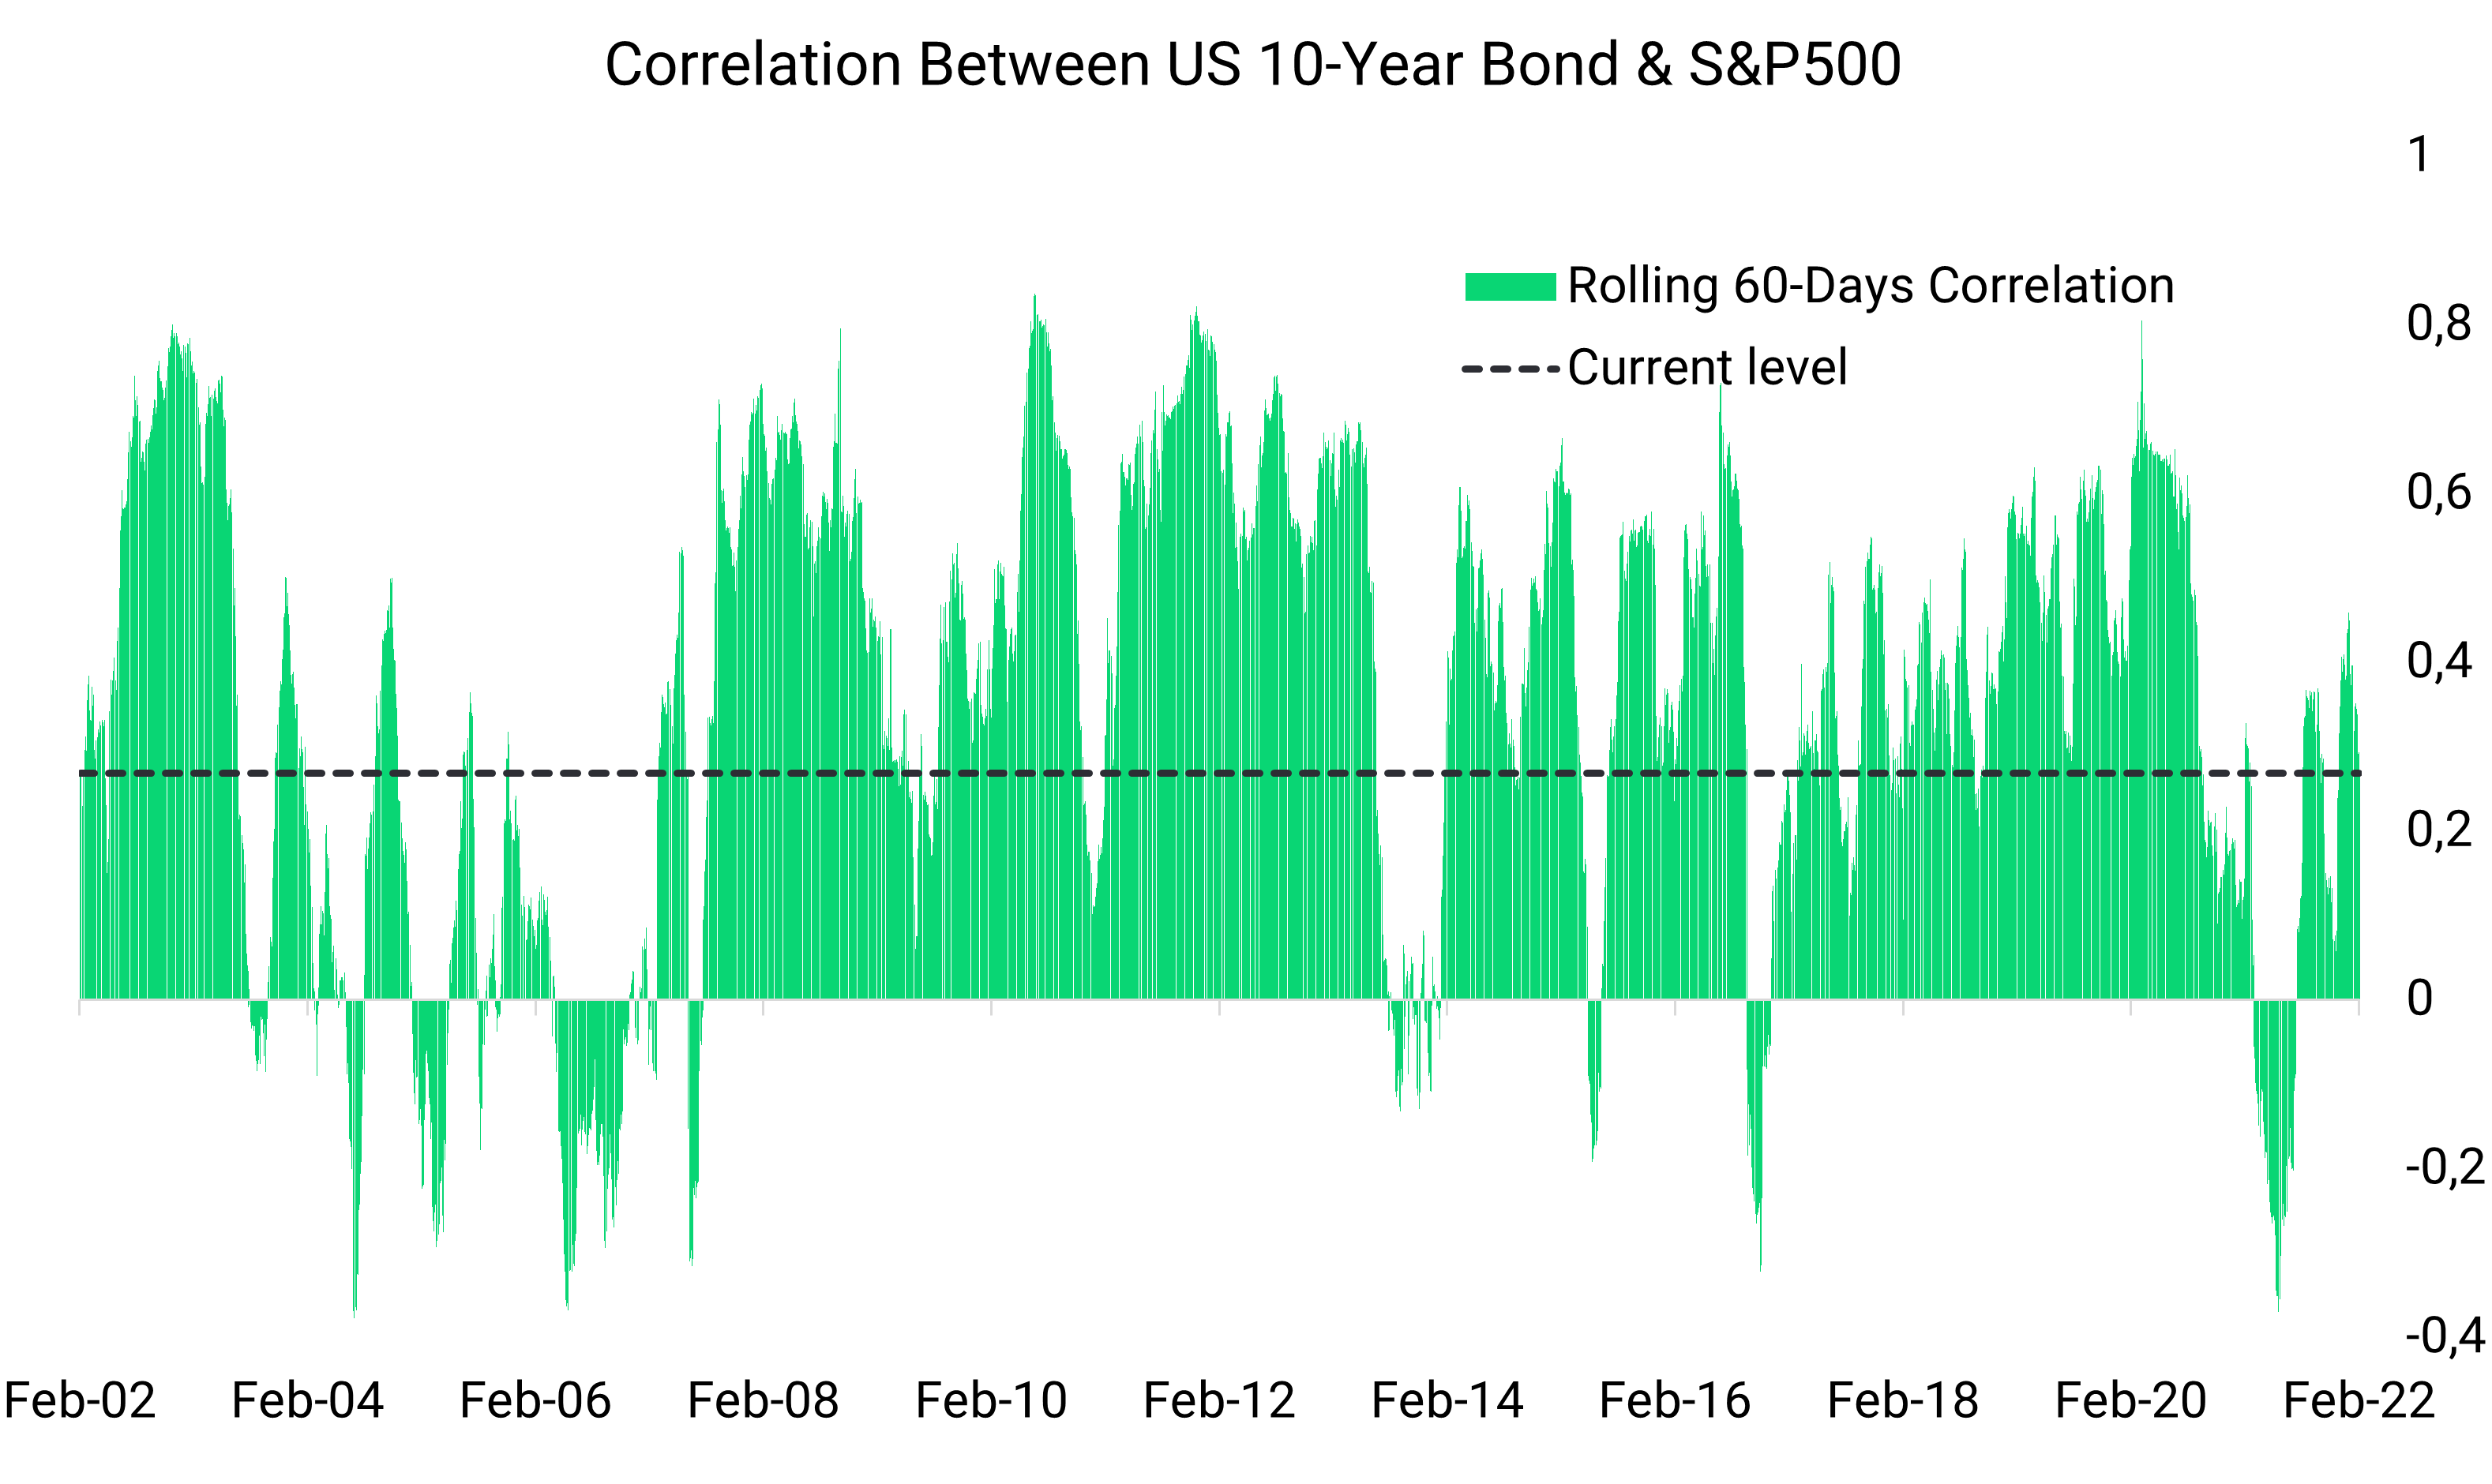
The reason why US Treasuries offer little protection this time, as the stock market is coming under pressure, is because the sell-off is due to a fear of interest rate hikes, which is bad for bonds as well, since bond prices fall when interest rates go up. In this type of environment, investor are better off holding bonds of an issuer whose performance is independent of the consequences of the US monetary policy. One country that has been able to play such a role is China. Since 2019, Chinese bonds have taken their own path, showing little correlation with the broader bond market.
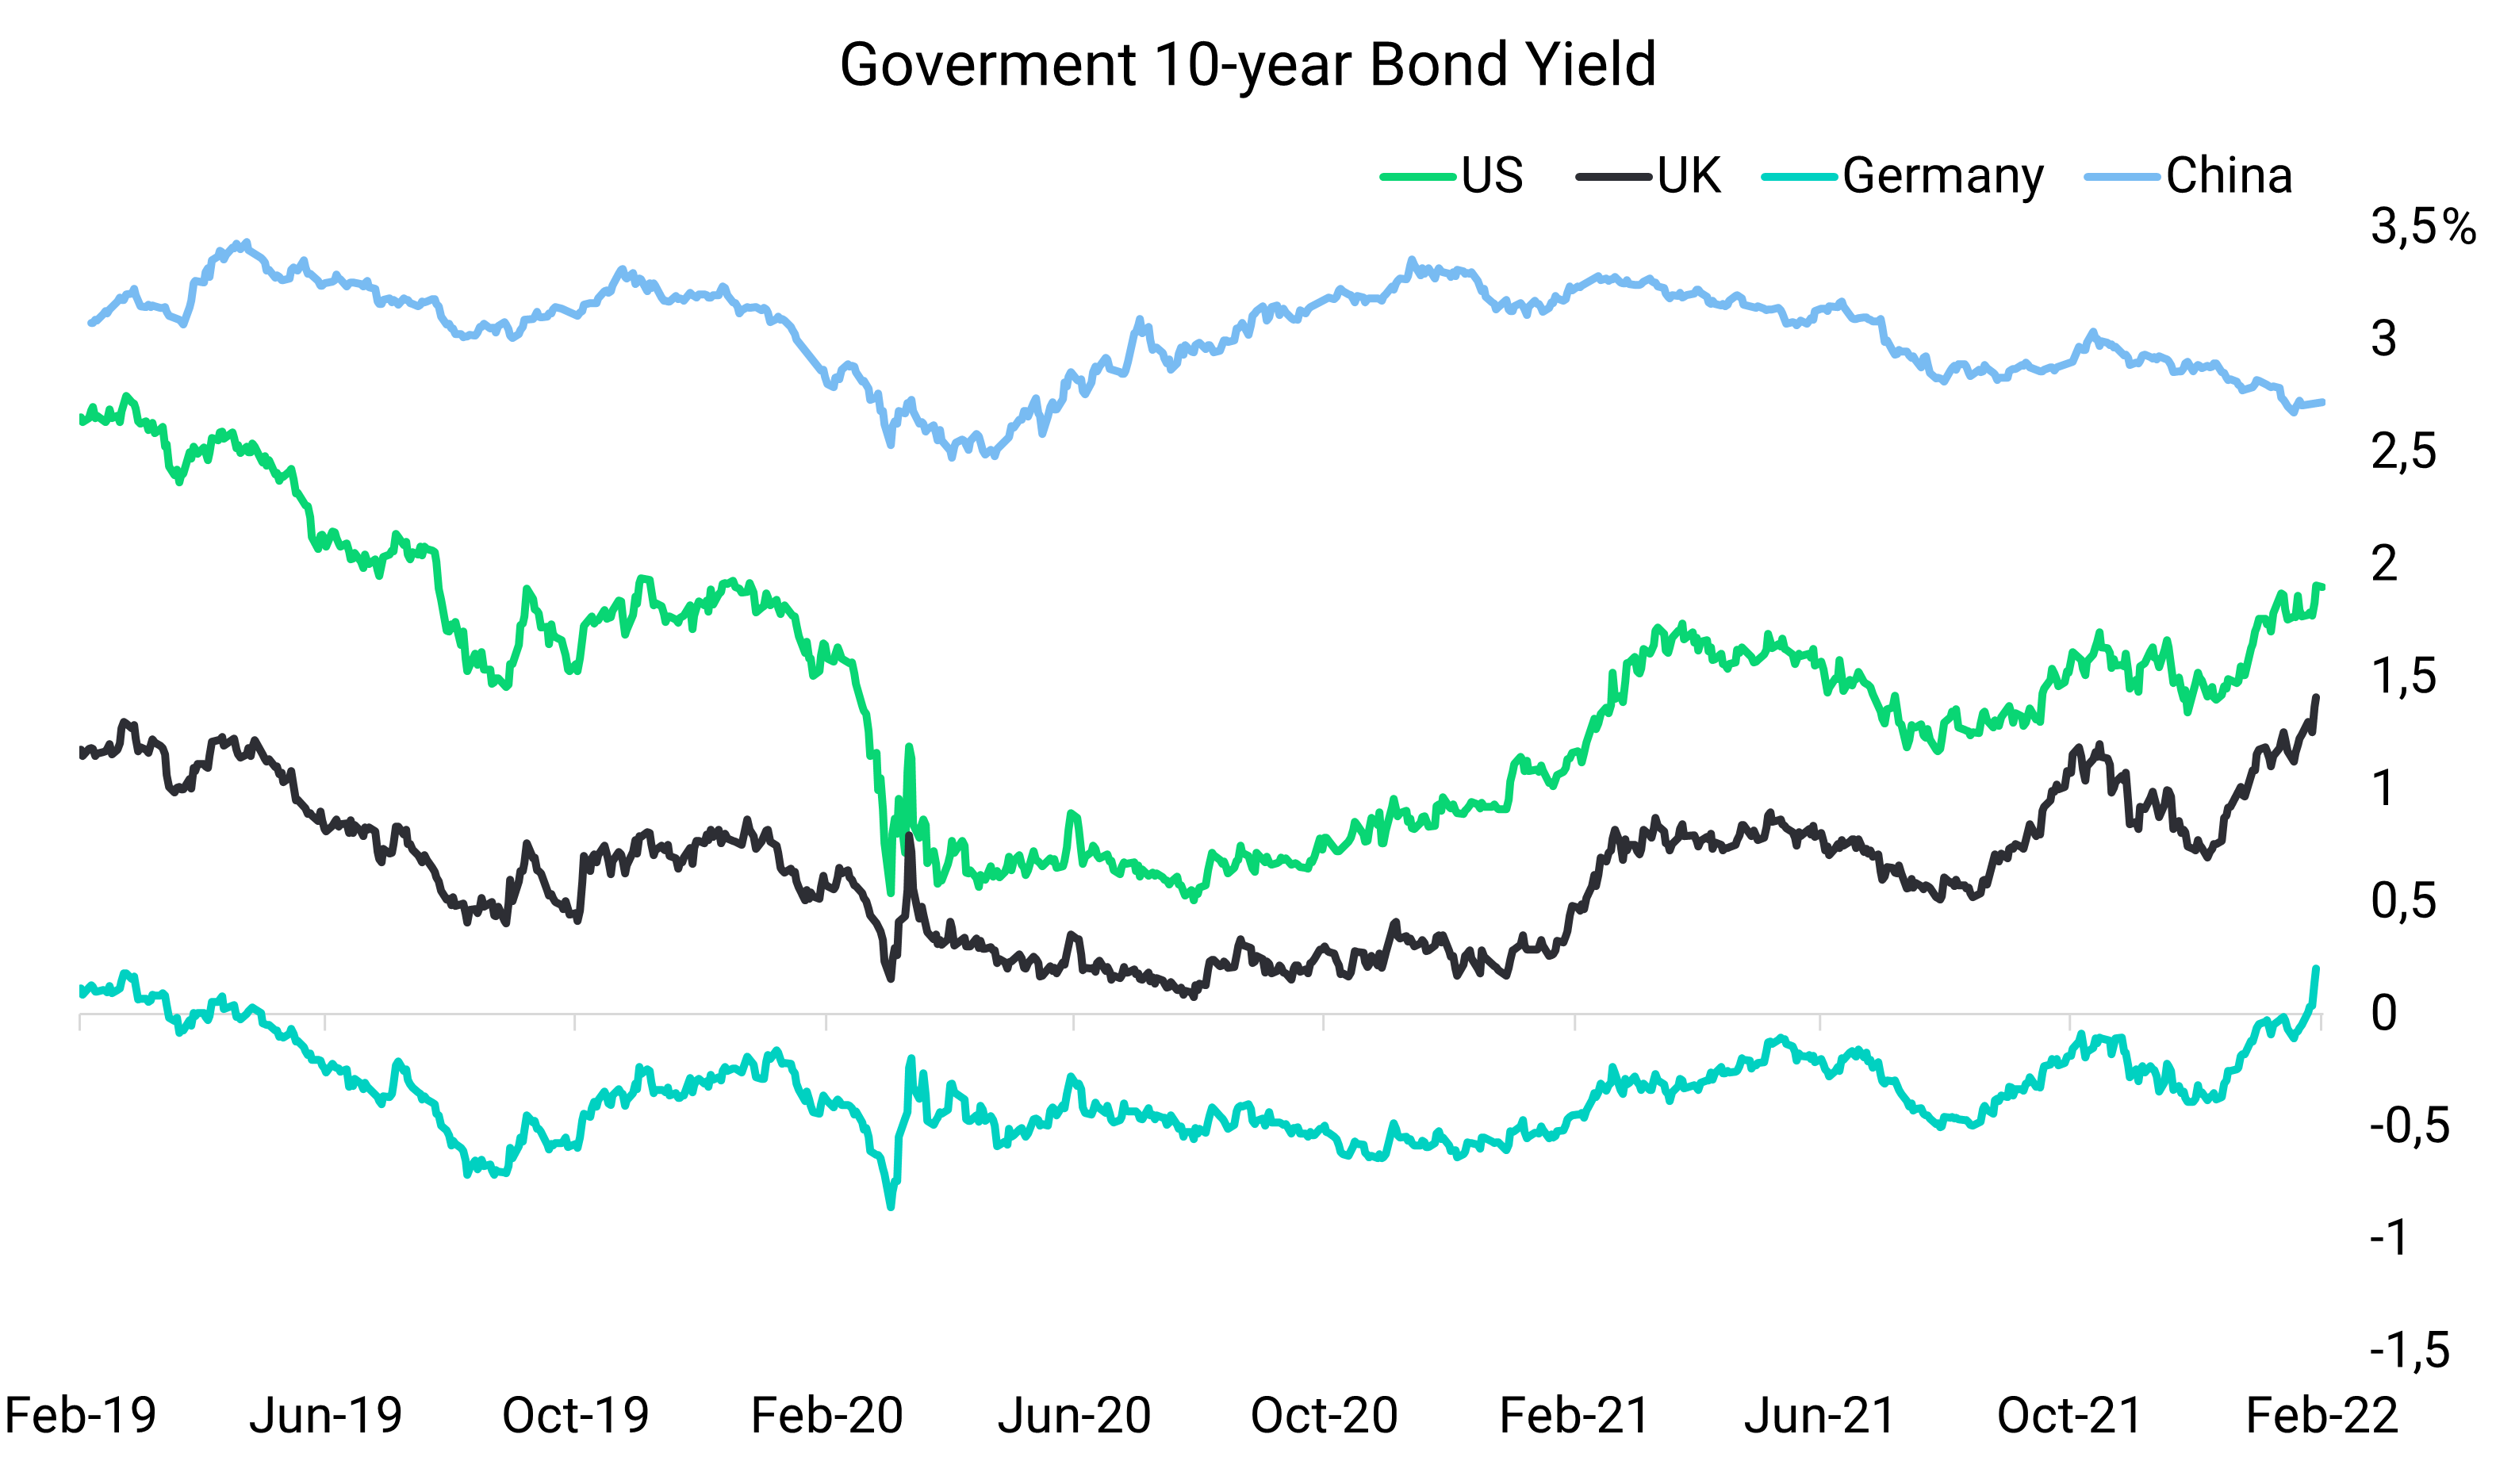
Moreover, given the strength of the Chinese economy, this can provide a reliable alternative to US Treasuries. Indeed, the VanEck China Bond ETF (CBON) is up 0.69% year-to-date, compared to -3.5% for US Treasuries and -6.17% for the S&P500, as of 7 February.
Opportunistic entry points
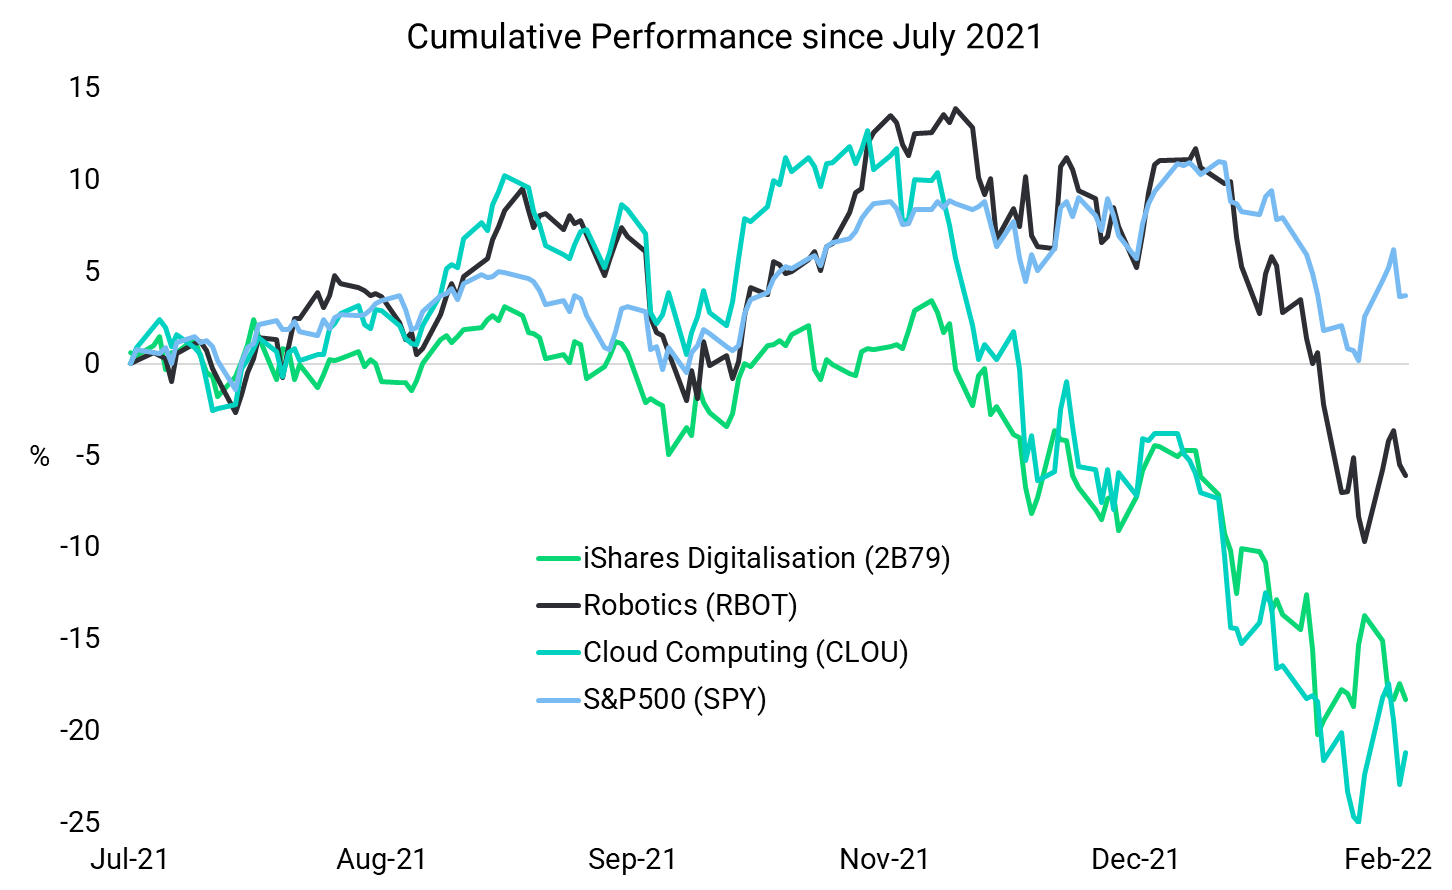
For the past 2 years, stock markets witnessed a great rally. Almost all stocks had double digit gains. However, going forward, tactical investing (security selection and asset allocation) will start to play an important role. While some areas of the market will likely suffer multiple compression in the aftermath of the Fed’s policy normalisation, other segments that benefit from long-term growth tailwinds should outperform. Therefore, these pullbacks could be seen as entry points to build longer-term exposure to sectors with strong fundamentals, such as the digital transformation, robotics, or cloud computing.
Low beta
In the world of investing, the volatility of a stock should not be disregarded as it plays an important role in how its price reacts in periods of stress. Investors are reminded of this every time that there is a downturn in the market, as individual stocks that are more volatile tend to experience bigger price swings.
Volatility is a proxy for risk; a portfolio with more volatility generally means a riskier portfolio. The volatility of a security or portfolio against a benchmark is called Beta. In short, Beta of 1.0 means the stock moves equally with the S&P500, and inversely a beta of -1.0 means the stock moves precisely opposite the S&P500. A beta of 0 means the stocks do not correlate with the S&P500. As investors get more nervous sentiment deteriorates, low beta stocks usually outperform, and high-beta companies.
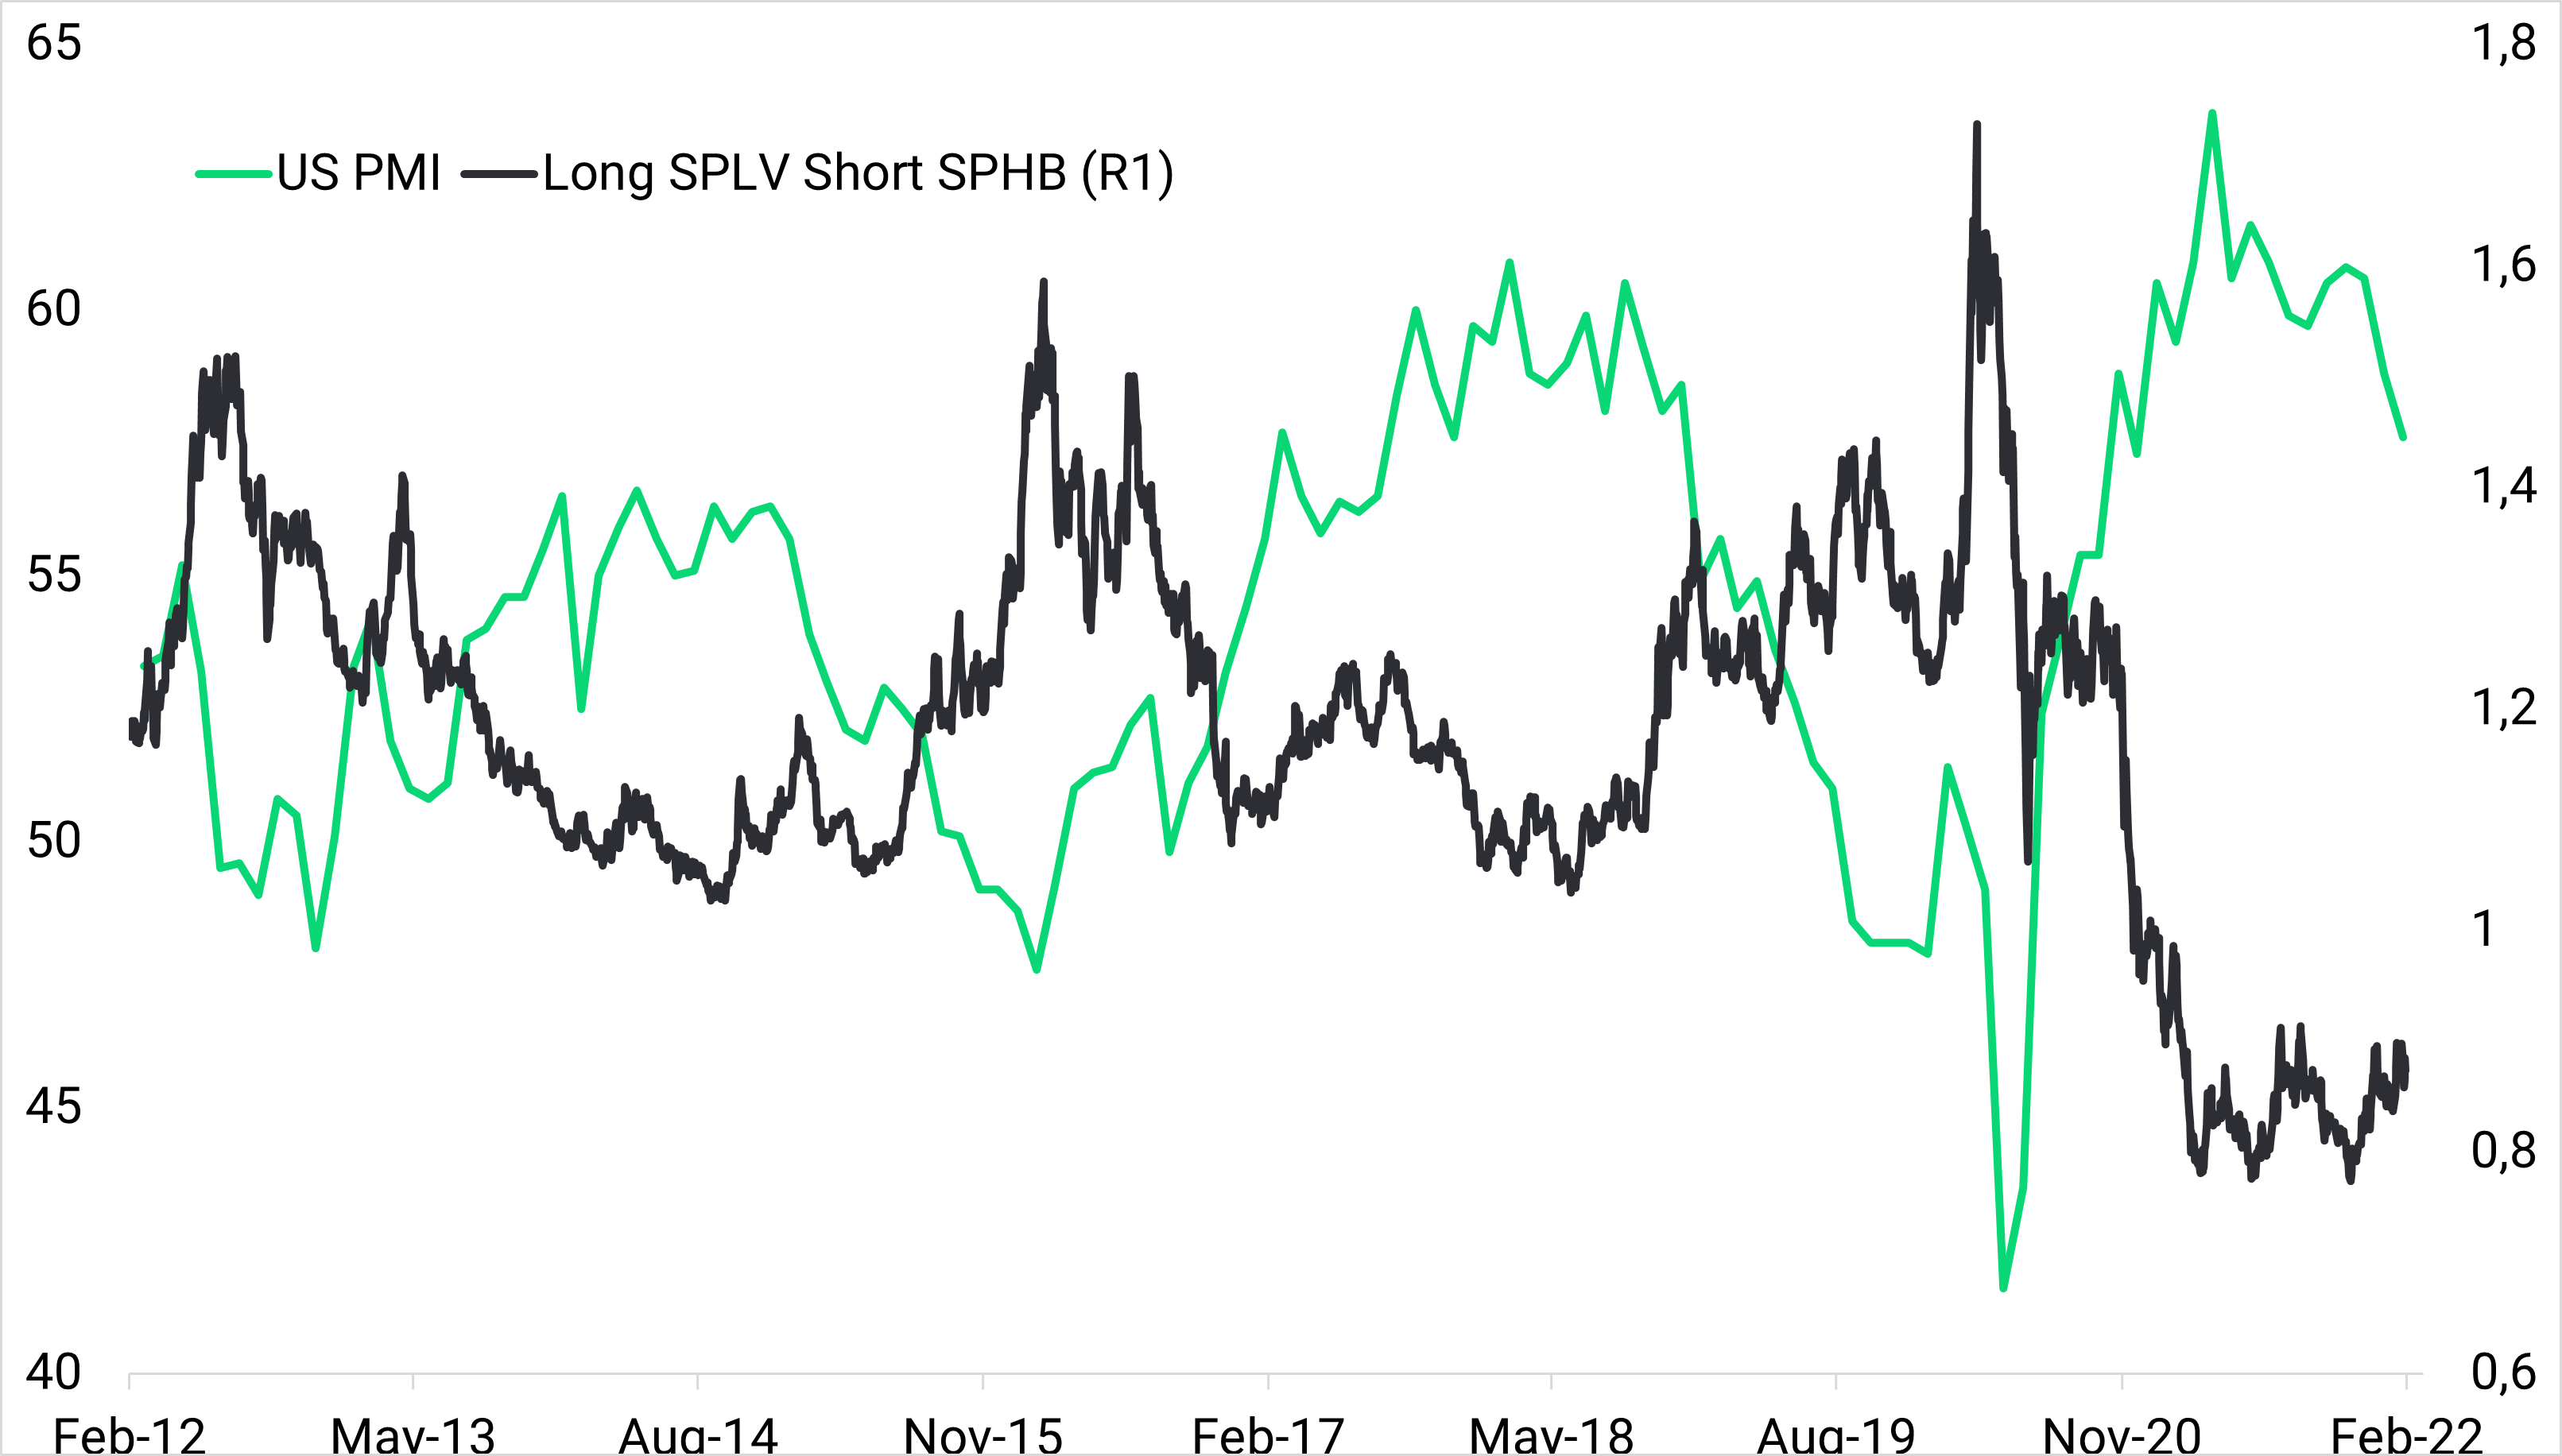
The graph below displays the US PMI (proxy for growth) and the performance of a strategy that goes long a low-beta fund (e.g.: SPLV) and short a high-beta fund (e.g.: SPHB). Historically, when growth weakens (PMI drops), low-beta stocks outperform on a relative basis. One could take advantage of this relationship by going long low-beta stocks and short high-beta stocks when almost everything else is yielding negative returns. This is a somewhat complex strategy and not intended for beginner investors.
Long volatility
Volatility is also one of the most important factors in determining the price of an option. Historical volatility is the actual volatility demonstrated by the underlying over a period. Implied volatility, on the other hand, is the level of volatility of the underlying that is implied by the current option price which is determined by the market participants.
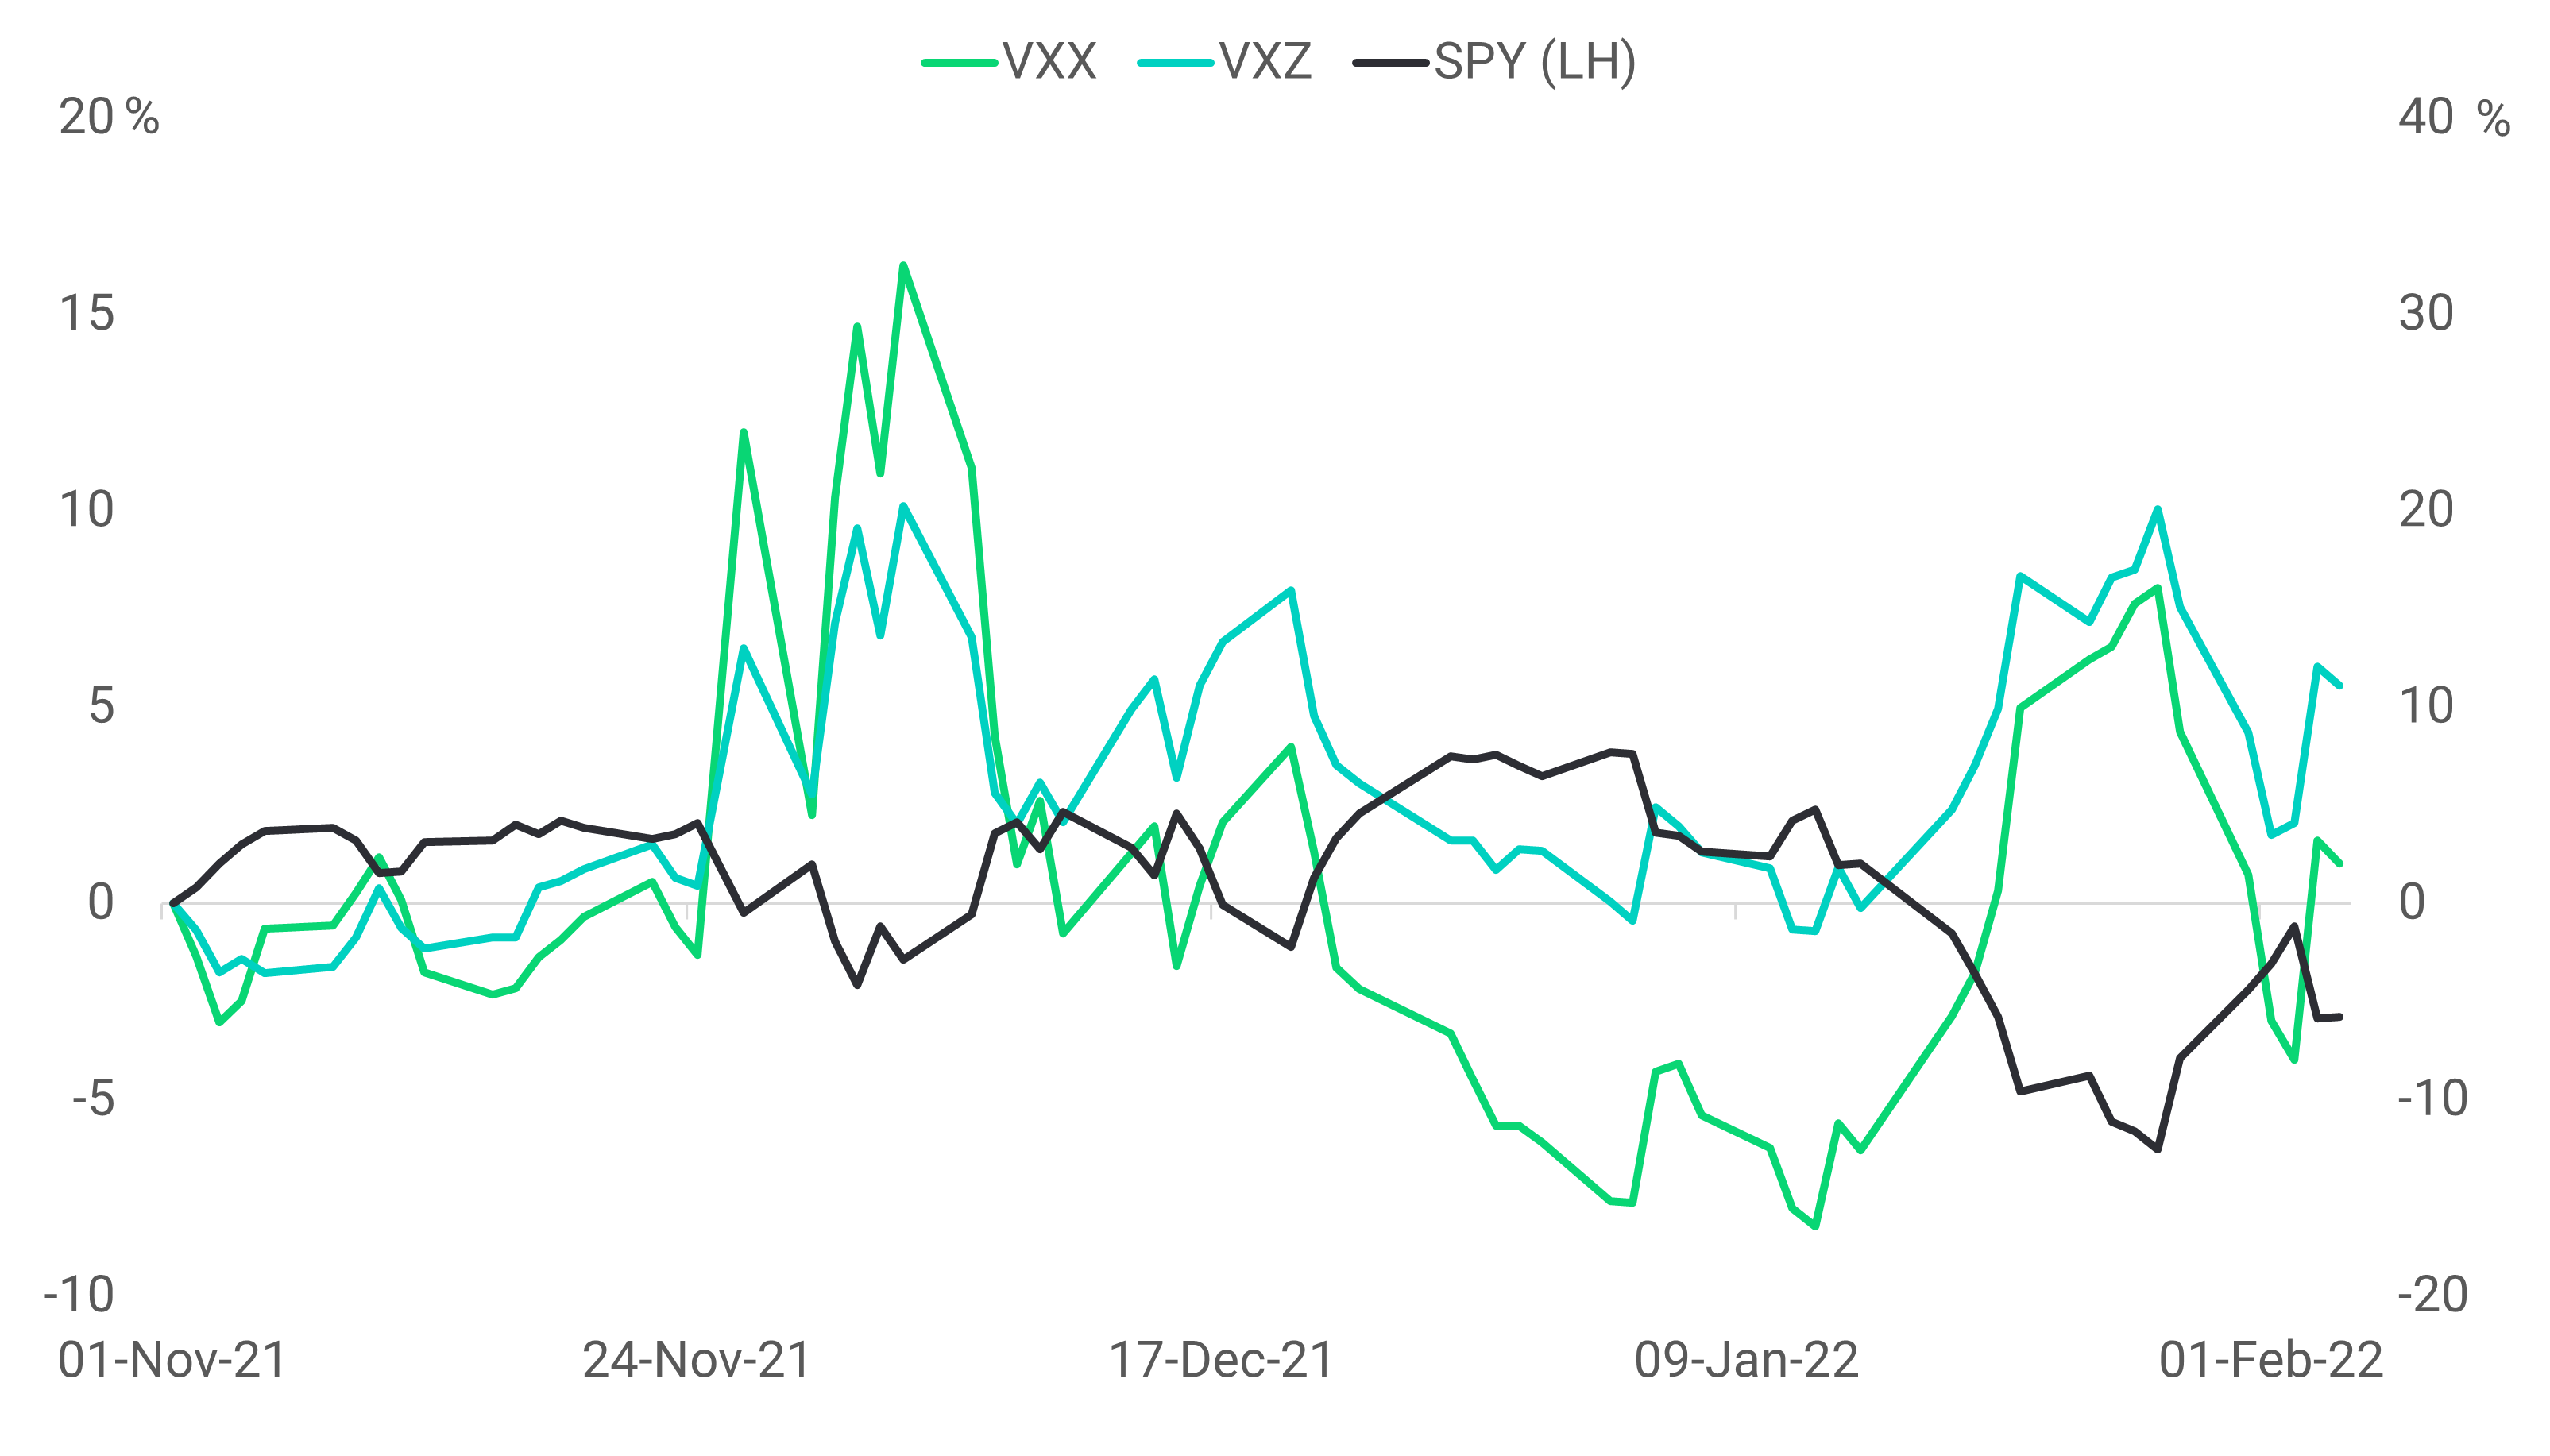
VIX is a real-time index representing the market’s expectation of 30-day forward-looking volatility, as derived from the prices of S&P500 options. It also serves as a measure of investor sentiment; high uncertainty usually translates into a higher VIX. The VIX cannot be invested in directly, but sophisticated investors can use VIX ETFs and ETN’s to hedge or speculate on the level of volatility in the short term. They are complex financial instruments and not intended for beginner investors. The most widely known liquid VIX products are the following:
iPath Series B S&P 500 VIX Mid-Term Futures ETN (VXZ)
iPath Series B S&P 500 VIX Short-Term Futures ETN (VXX)
Looking at the graph below, one can see that the two VIX ETNs are nearly perfectly negatively correlated to the S&P500 (SPY). It is worth noting that VXX is composed of shorter-term futures contracts, and therefore has a higher correlation to the spot VIX.
Looking ahead
Chances are that we are in a bull market correction and not at the start of a bear market. With real rates still negative, we believe that stocks remain an attractive place to be invested in. However, for investors fearing a further fall in prices, the strategies mentioned above should help to reduce concentrated exposure to market risk.

