An updated weekly analysis of the price action across stock indices, forex and commodities.
S&P 500
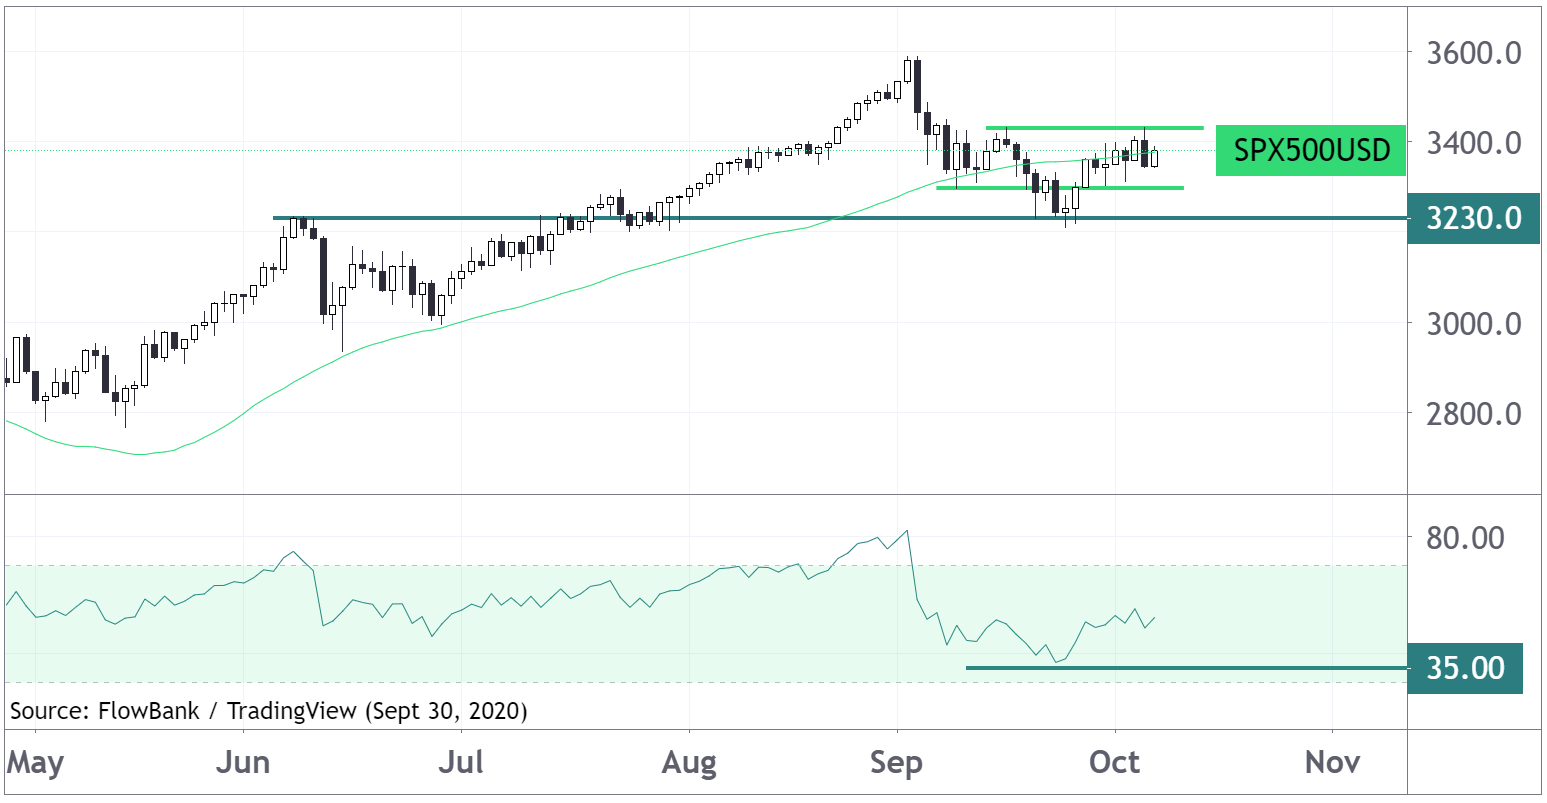
The S&P 500 is forming a potential inverse head and shoulders pattern with 3420 as the neckline. RSI holding above 35 is indicative of an uptrend.
Swiss Market Index (SMI)
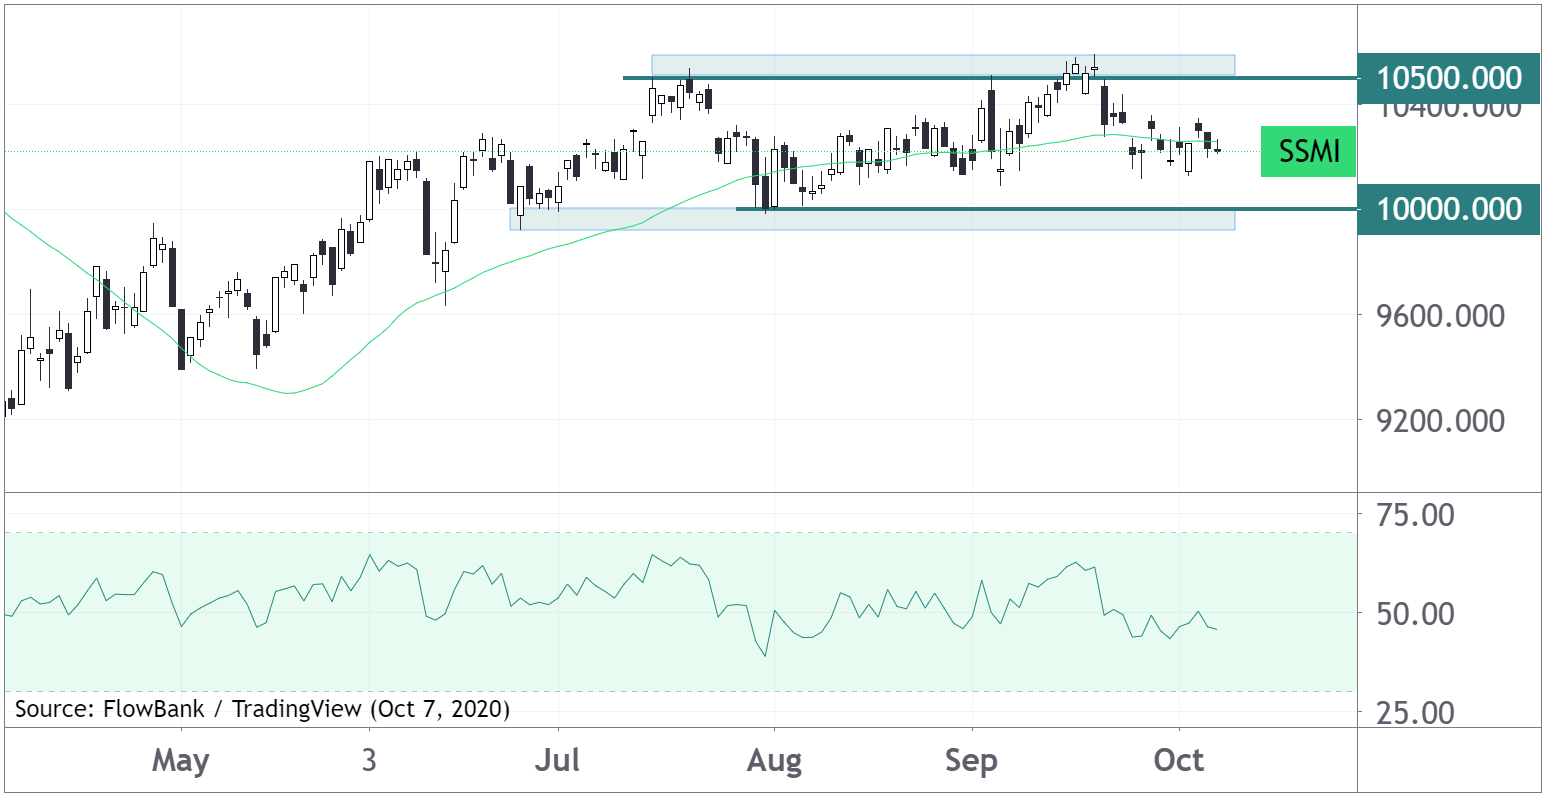
The SMI is going sideways - stuck to its 50 DMA and in the middle of a 10,000 to 10,500 trading range.
EUR/USD
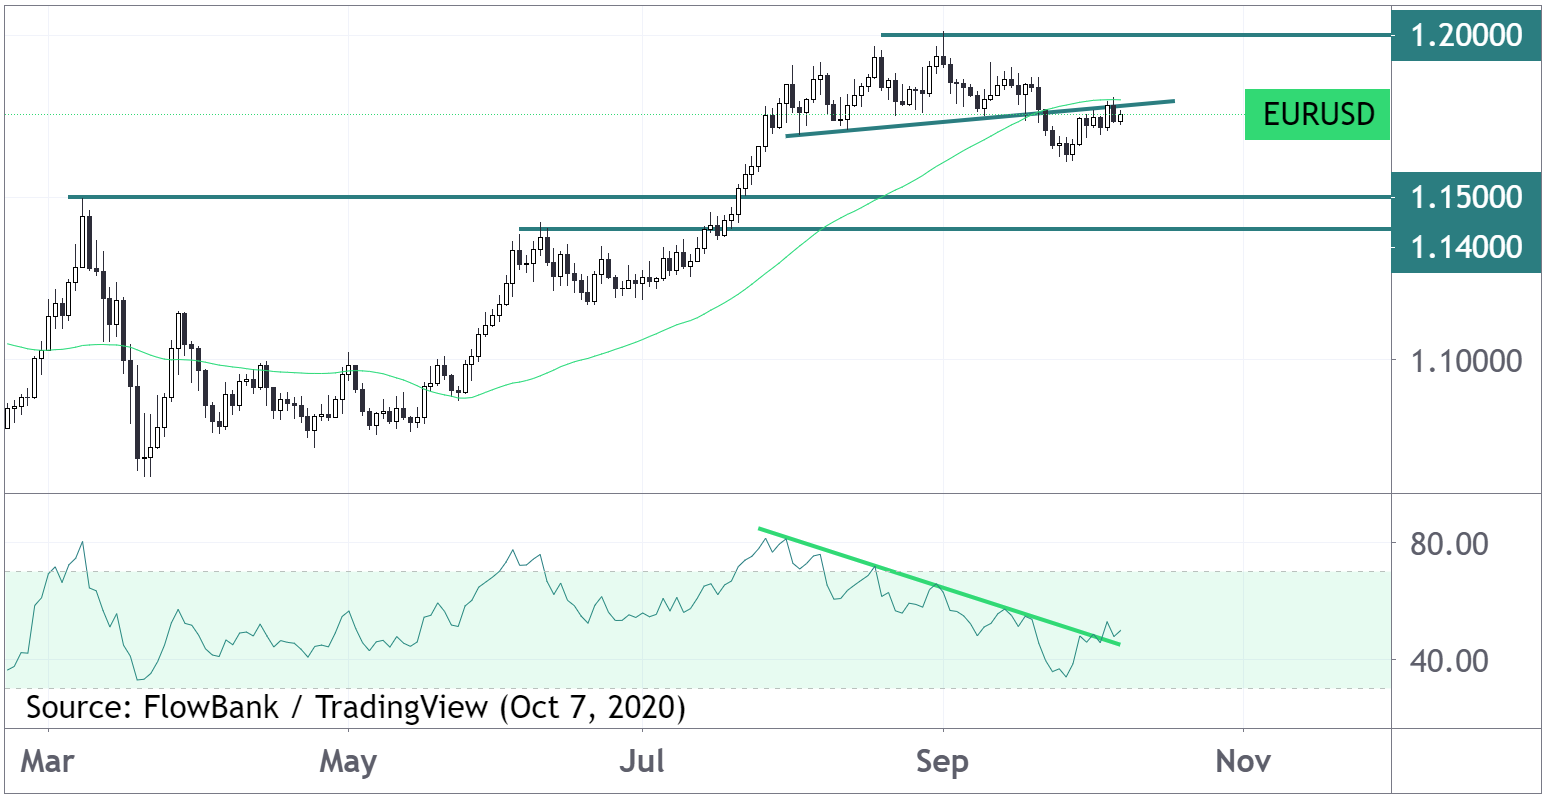
The euro-dollar exchange rate has stalled at a previously broken up-trendline and the 50 DMA. A break above a falling RSI trendline suggests a break higher in price.
GBP/USD
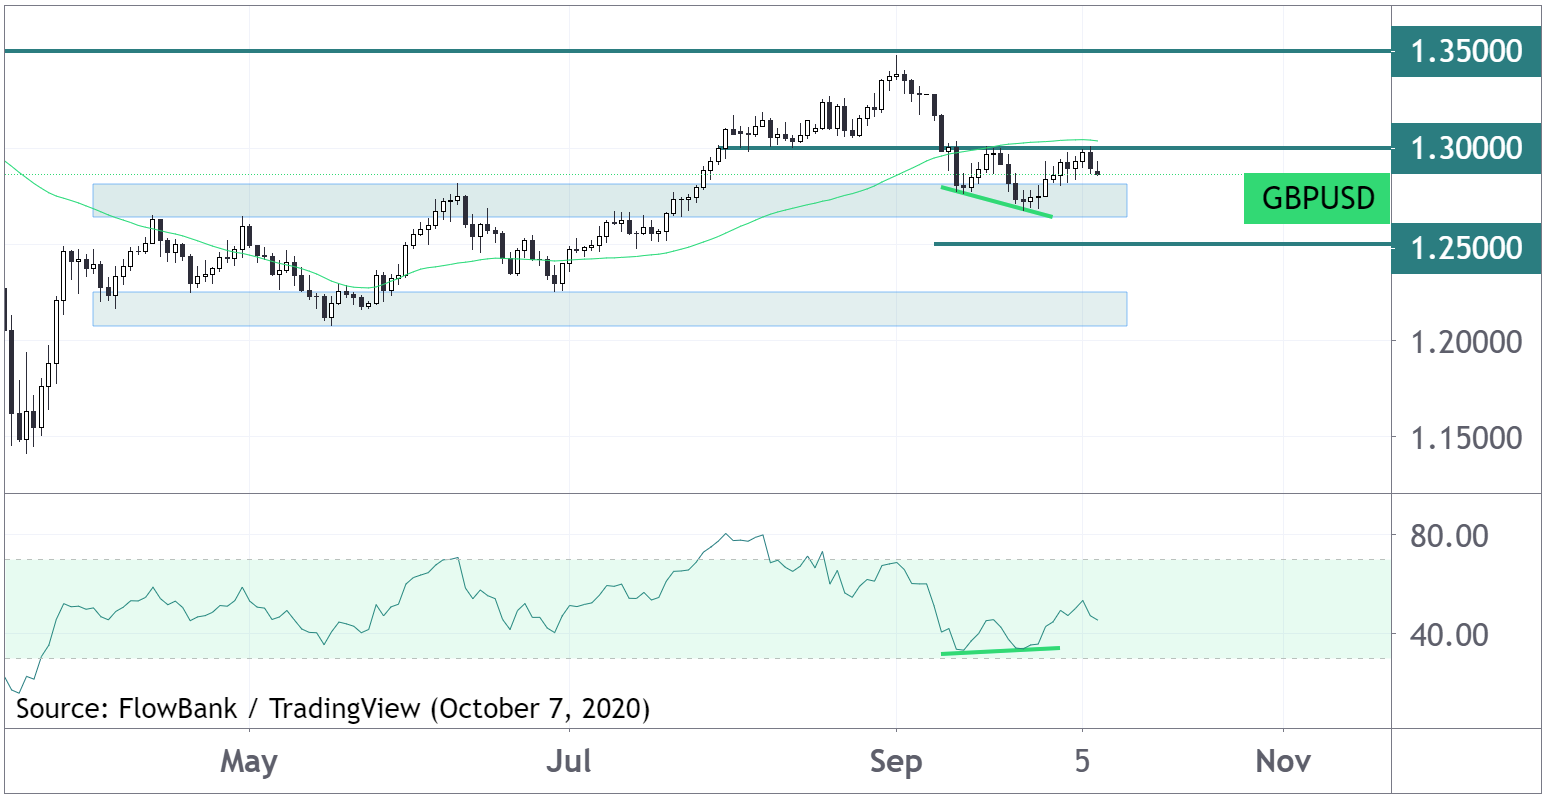
The pound dollar has twice found resistance at 1.30 and its 50 DMA. A bullish divergence on the RSI suggests an upside break.
Gold
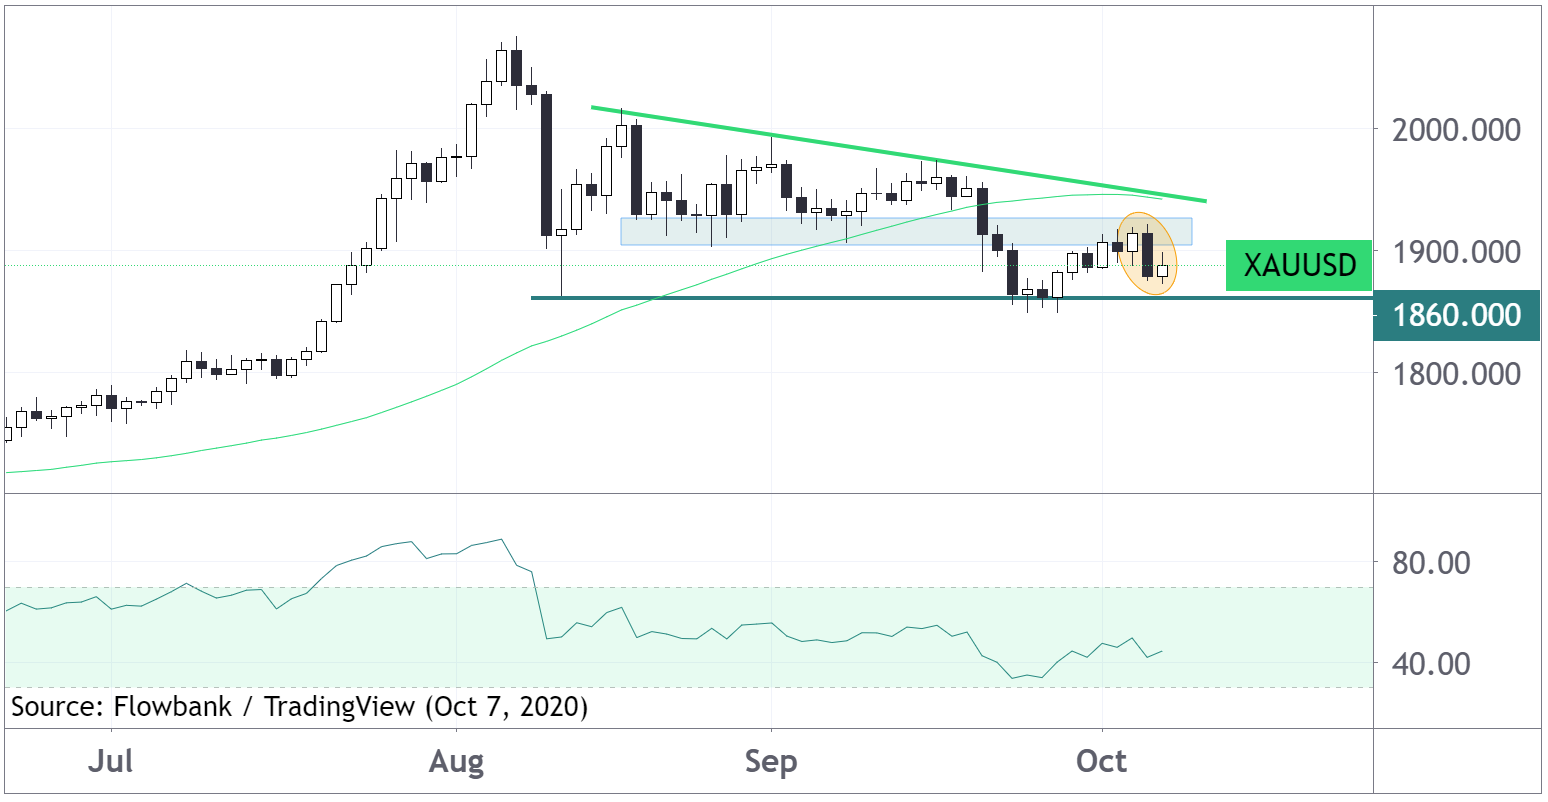
Gold has formed a bearish engulfing candlestick pattern at around $1900 per oz- which was former support. The implies bearish momentum which could take price below support at $1860.
Oil
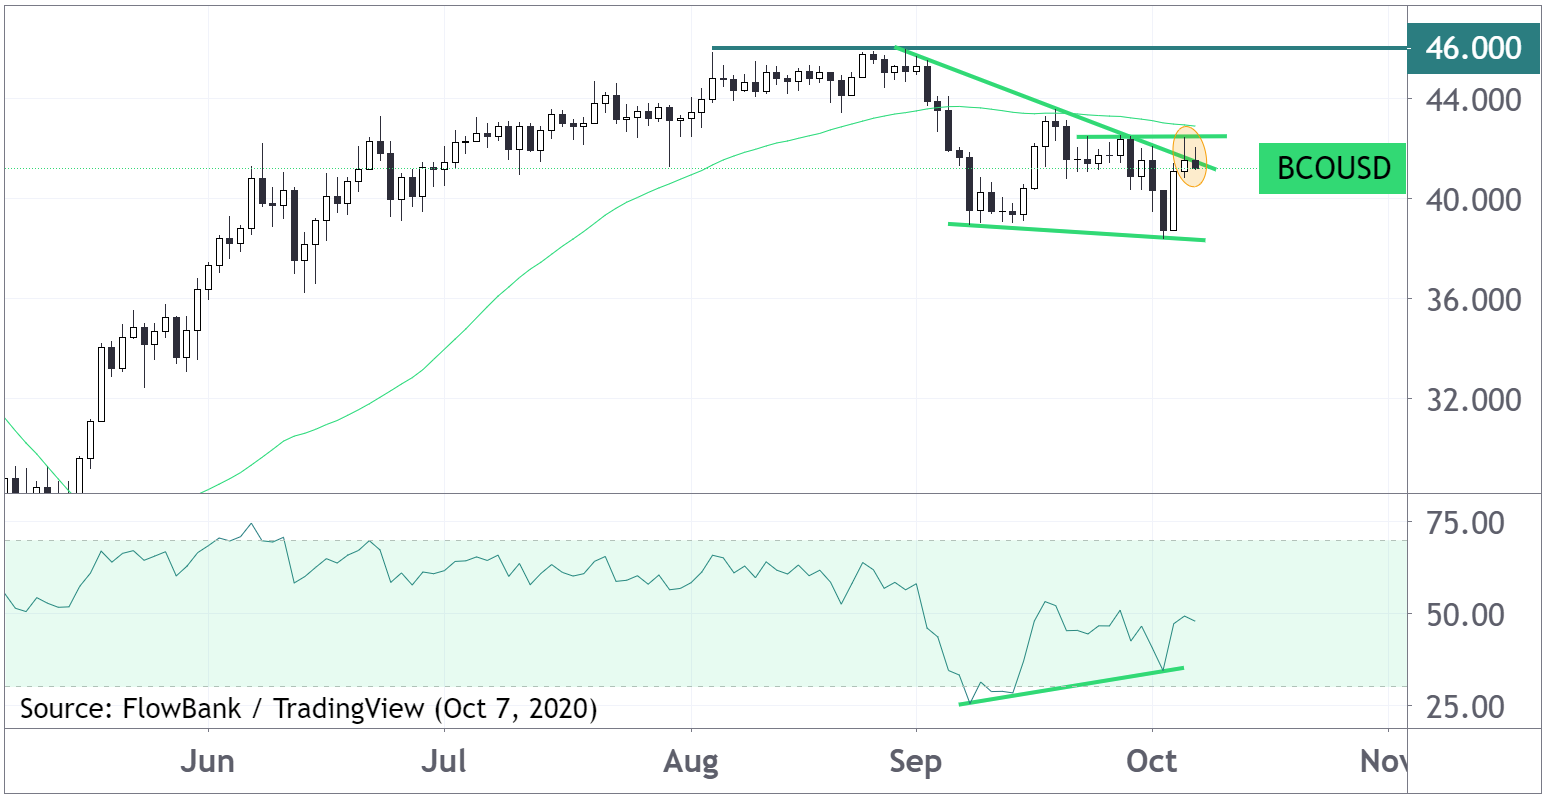
Brent crude oil (BCO/USD) has made a false breakout of a falling trendline at recent highs of $42.50 per barrel. Then trend is short-term bearish while under the 50 DMA but bullish divergence in RSI indicates a possible break higher.