An updated weekly analysis of the price action across stock indices, forex, cryptocurrencies and commodities.
DAX
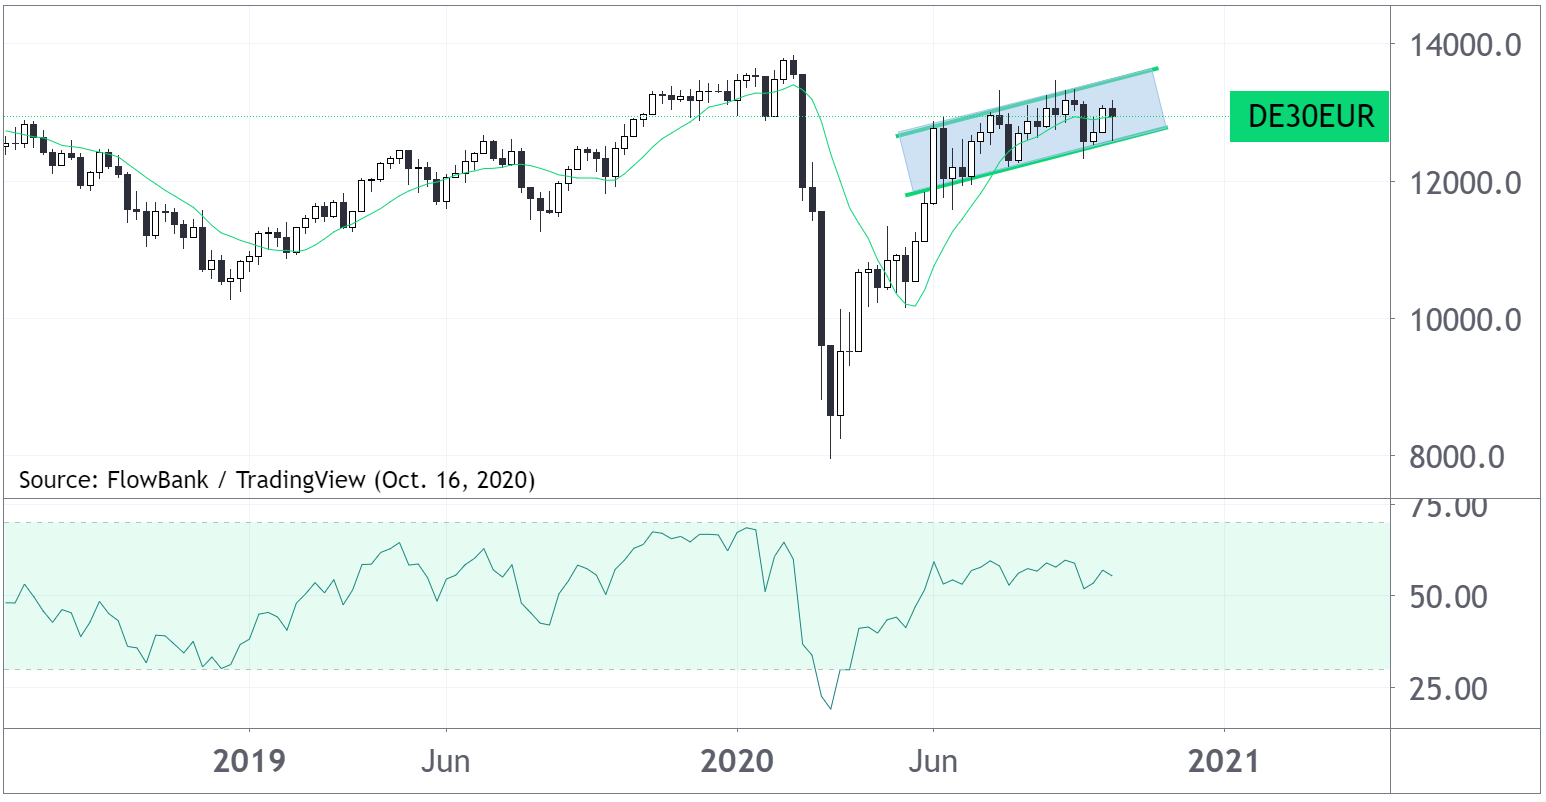
Germany's DAX index is trading within a rising channel beneath its 2020 price peak. The trend is technically still bullish but has lost momentum. A downside break could open up a significant correction.
FTSE 100
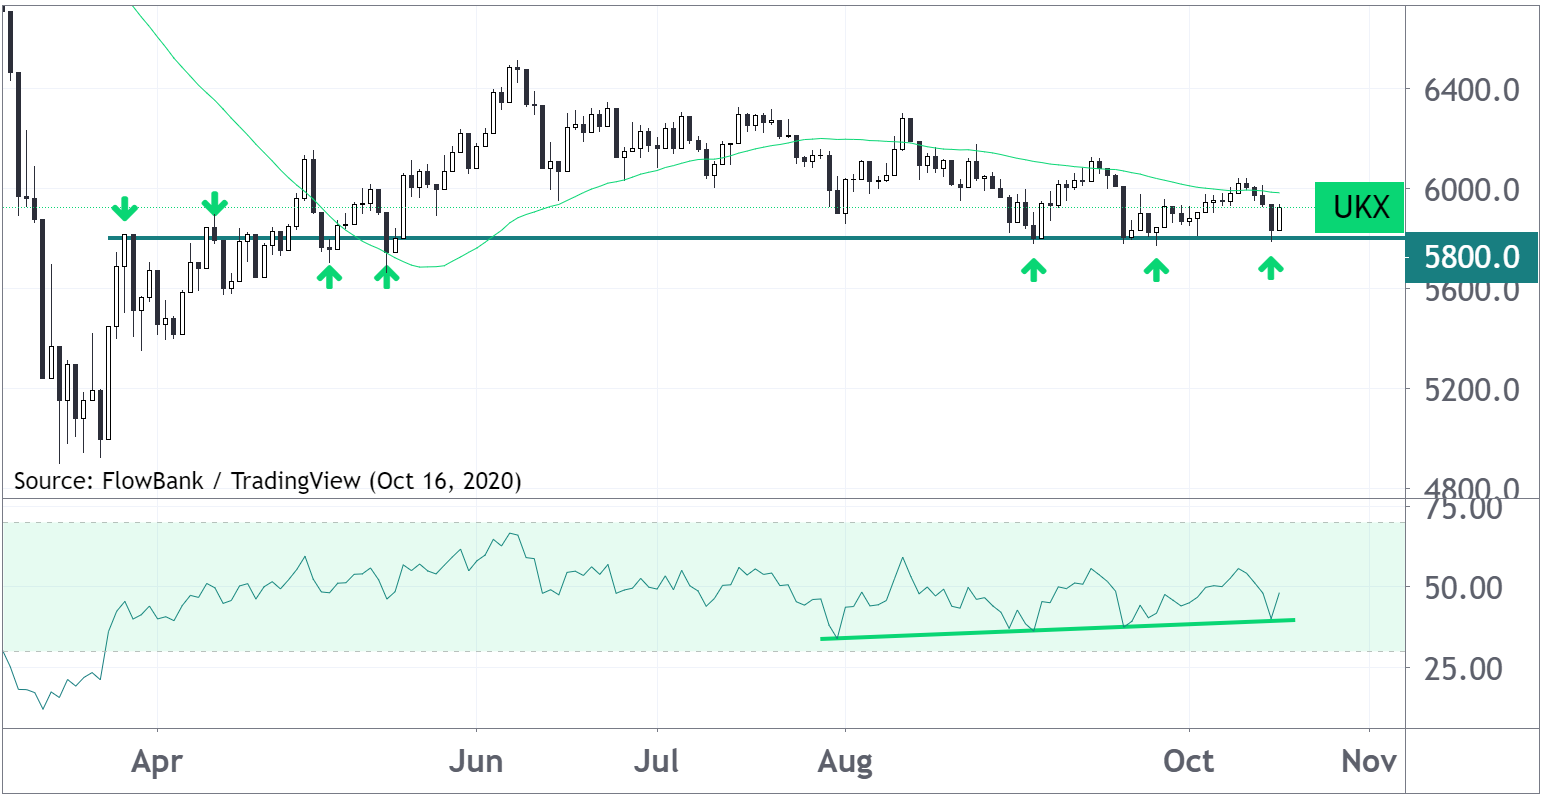
The FTSE 100 has again held onto critical support at 5,800 price support. The series of lower highs is bearish whereas the divergence across the lows in the RSI indicator is bullish.
EUR/CHF
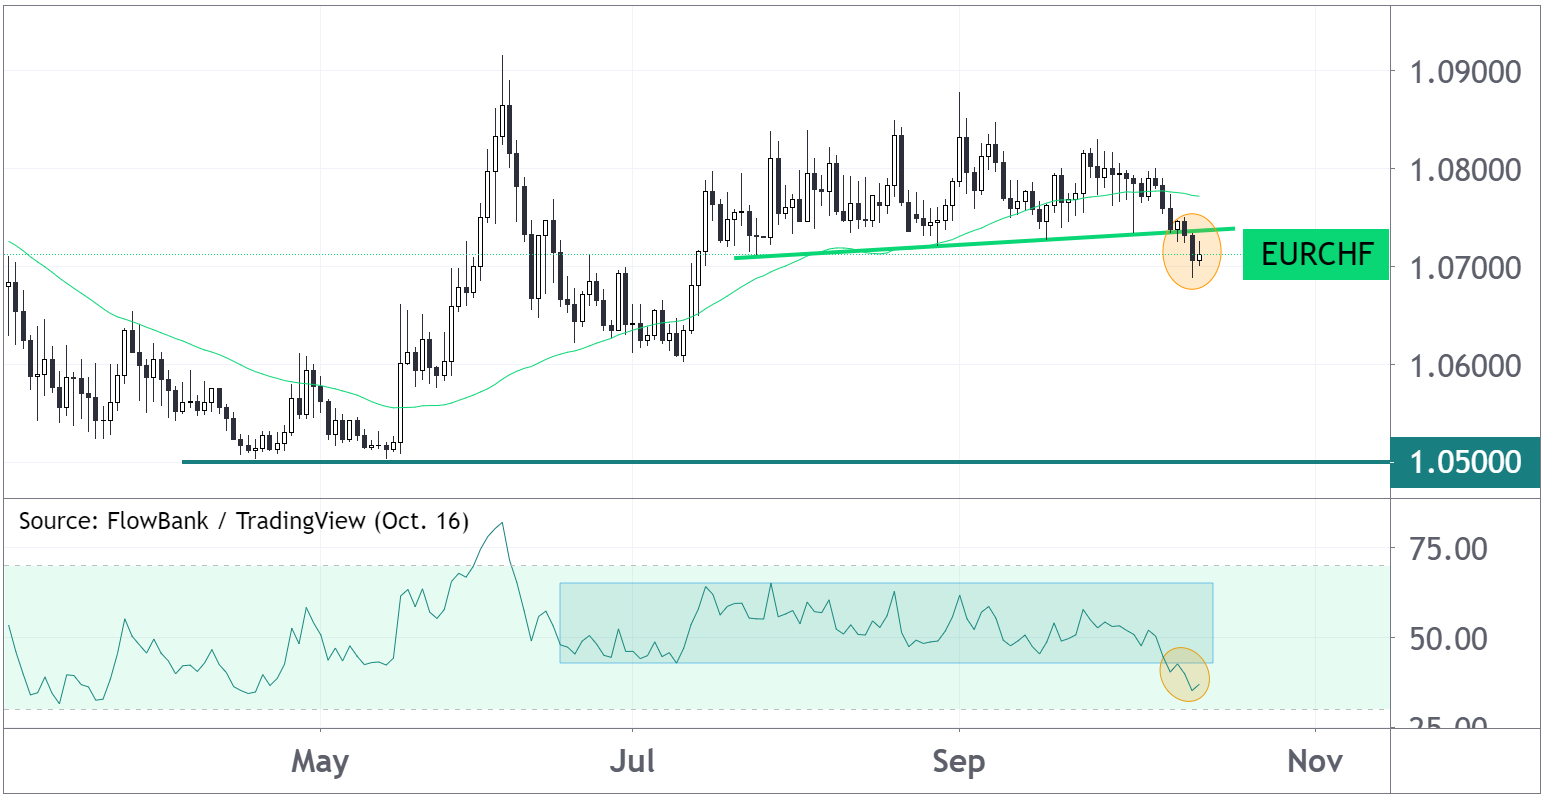
The euro-swiss franc exchange rate has broken down from a 3-month old sideways trading range, while the RSI indicator has hit its lowest level since April - suggesting a bearish shift in the trend. Major support rests at 105 with 109 as major resistance.
EUR/GBP
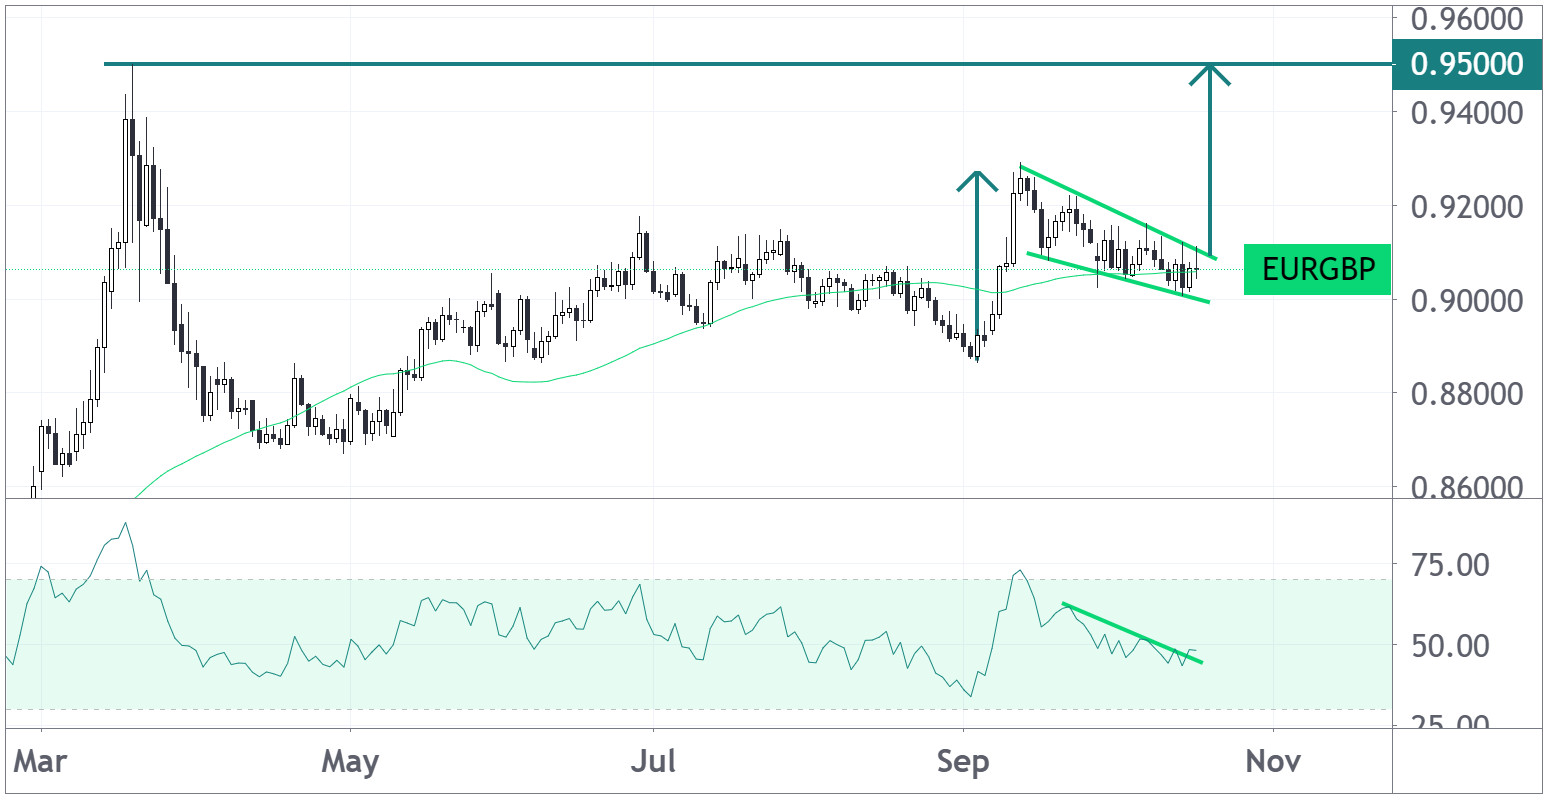
The euro-Sterling currency pair is stuck in a falling wedge formation. If the move up from the September low is used as a measured move objective on the topside, price would reach resistance at 0.95.
Bitcoin
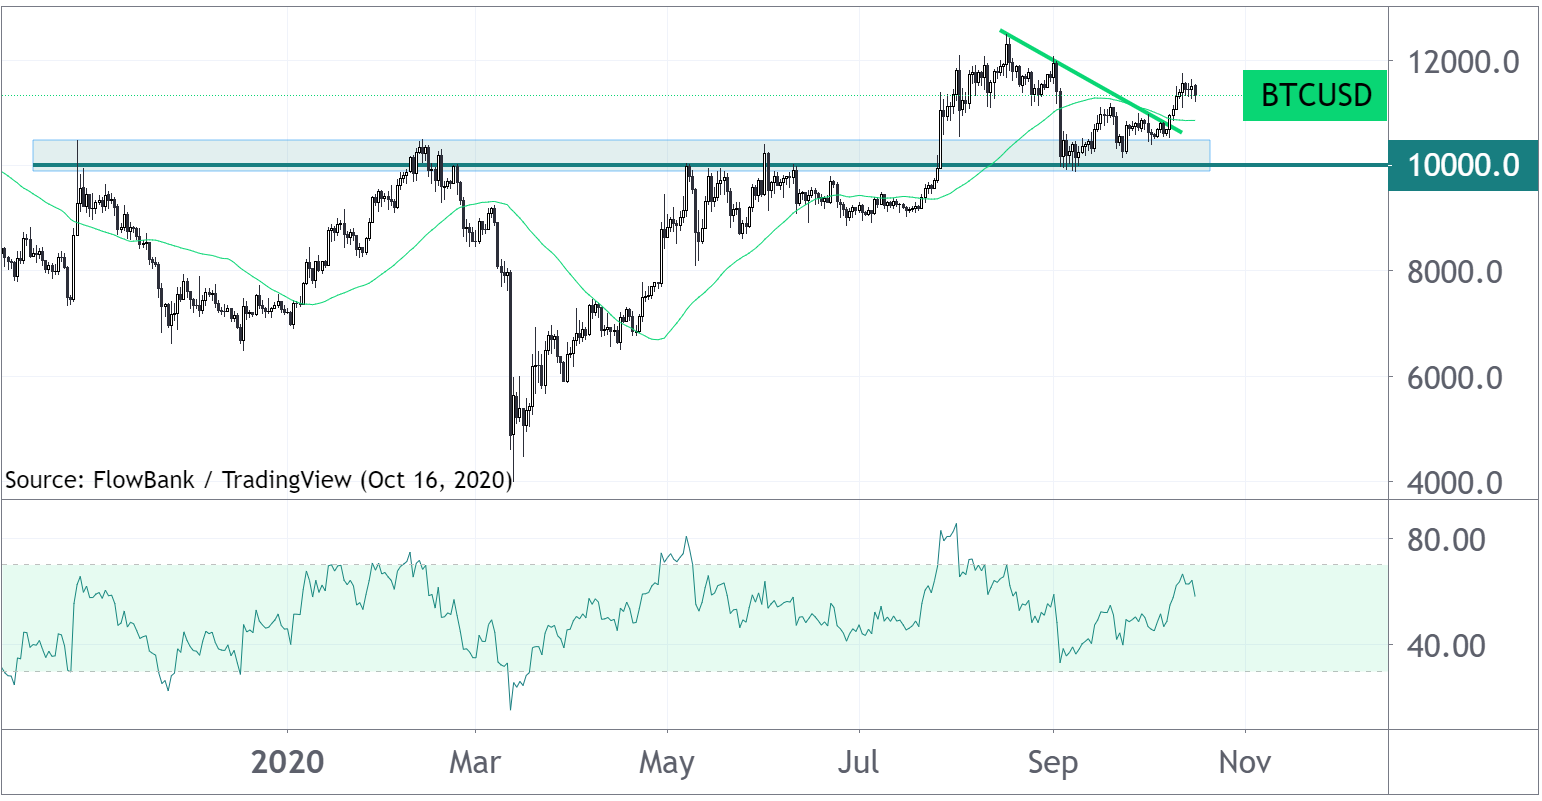
Bitcoin has broken the resistance zone of 10,000-10,500 and held it as support in a subsequent pullback in a classic bullish formation. It has since broken above a falling trendline and back above its 50 DMA.
Copper
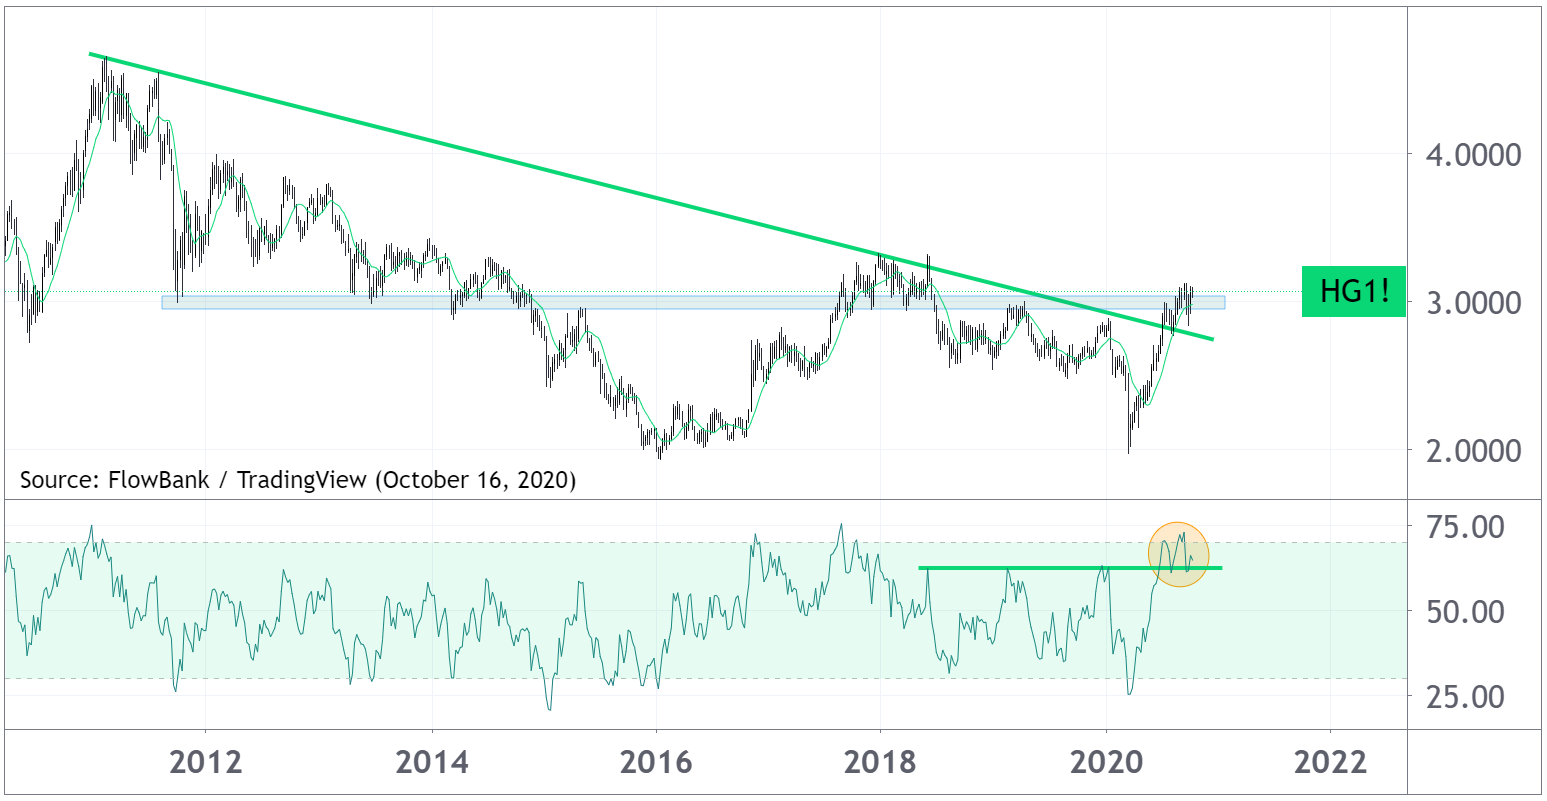
Copper has broken a 9-year old falling trendline but has stalled at $3.0 per lb - an important psychological and long term S/R level. The RSI is overbought but remains above broken resistance.