An updated weekly analysis of the price action across stock indices, including the S&P 500, SMI, FTSE & DAX charts.
S&P 500
The S&P 500 is re-testing the broken 50-day moving average as resistance. The index price rebounded from 3200, which was former resistance near the June high and broke above a declining trendline, suggesting a possible end to the correction of the uptrend.
Swiss Market Index (SMI)
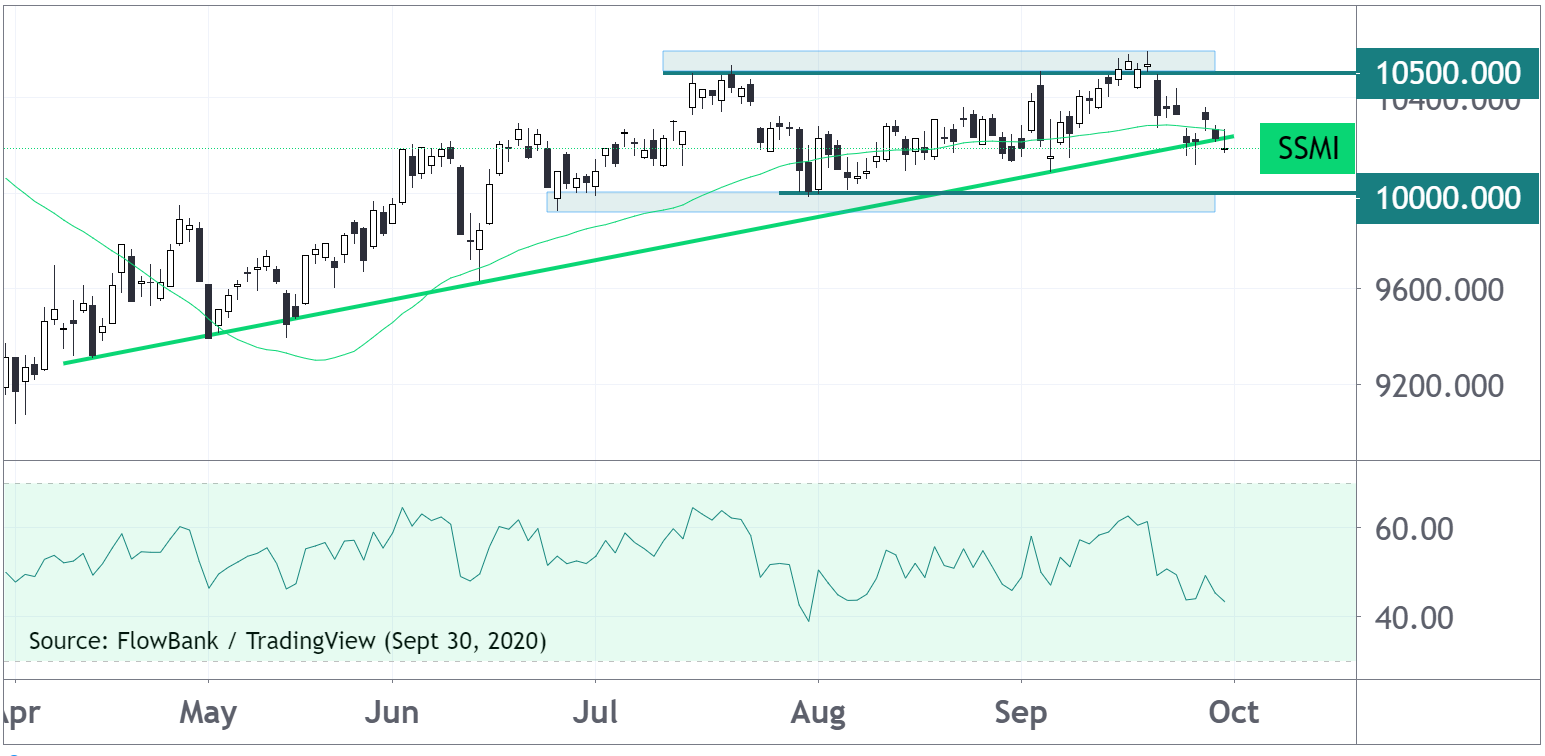
The SMI broke below its 50-day moving average in late July and has since been rangebound between 10k and 10.5k. The break of a rising trendline in place since April is a potentially bearish signal.
FTSE 100
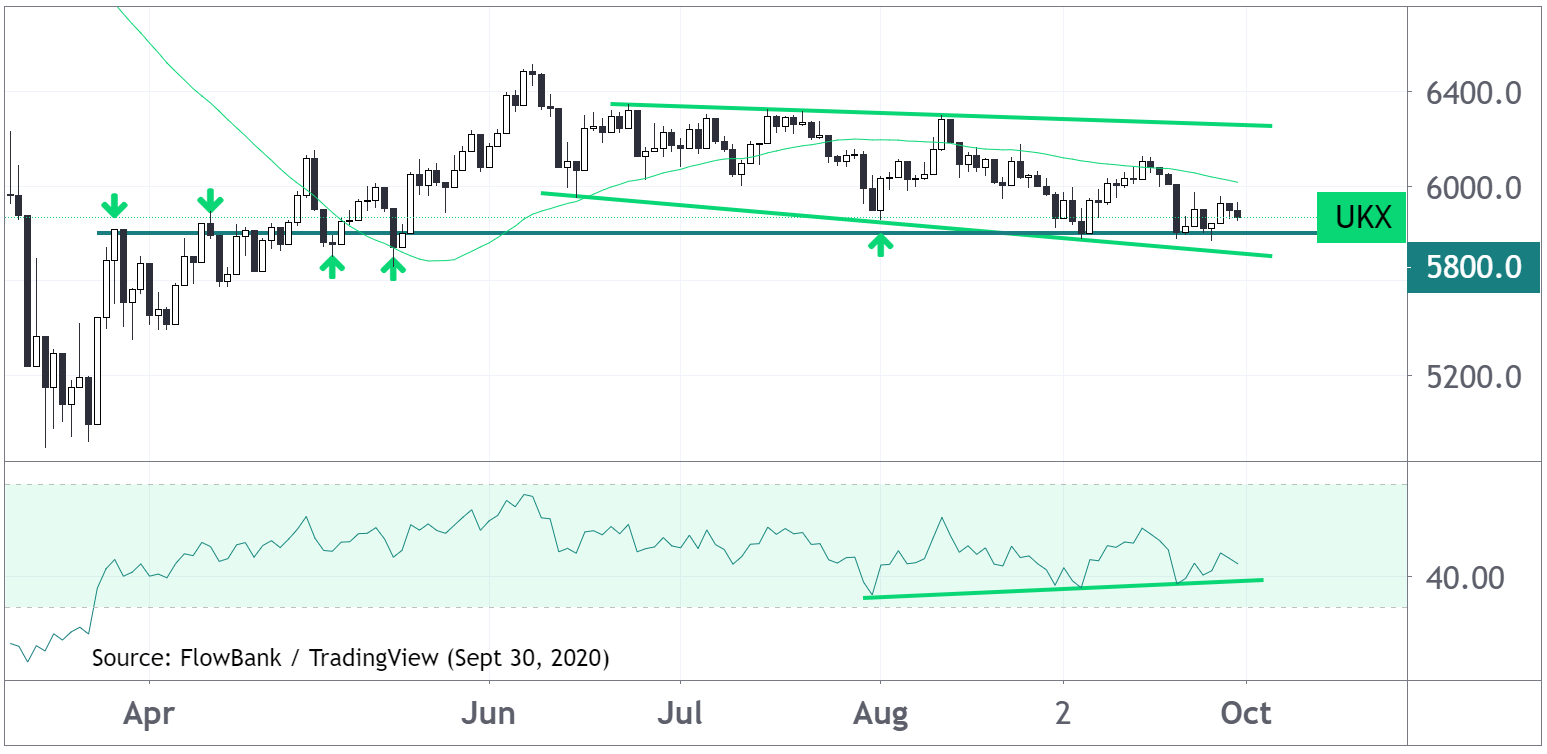
The FTSE 100 is in a modestly declining sideways range with the 50 DMA more recently acting as resistance while the 5800 level (April peaks / May lows) acting as support.
DAX
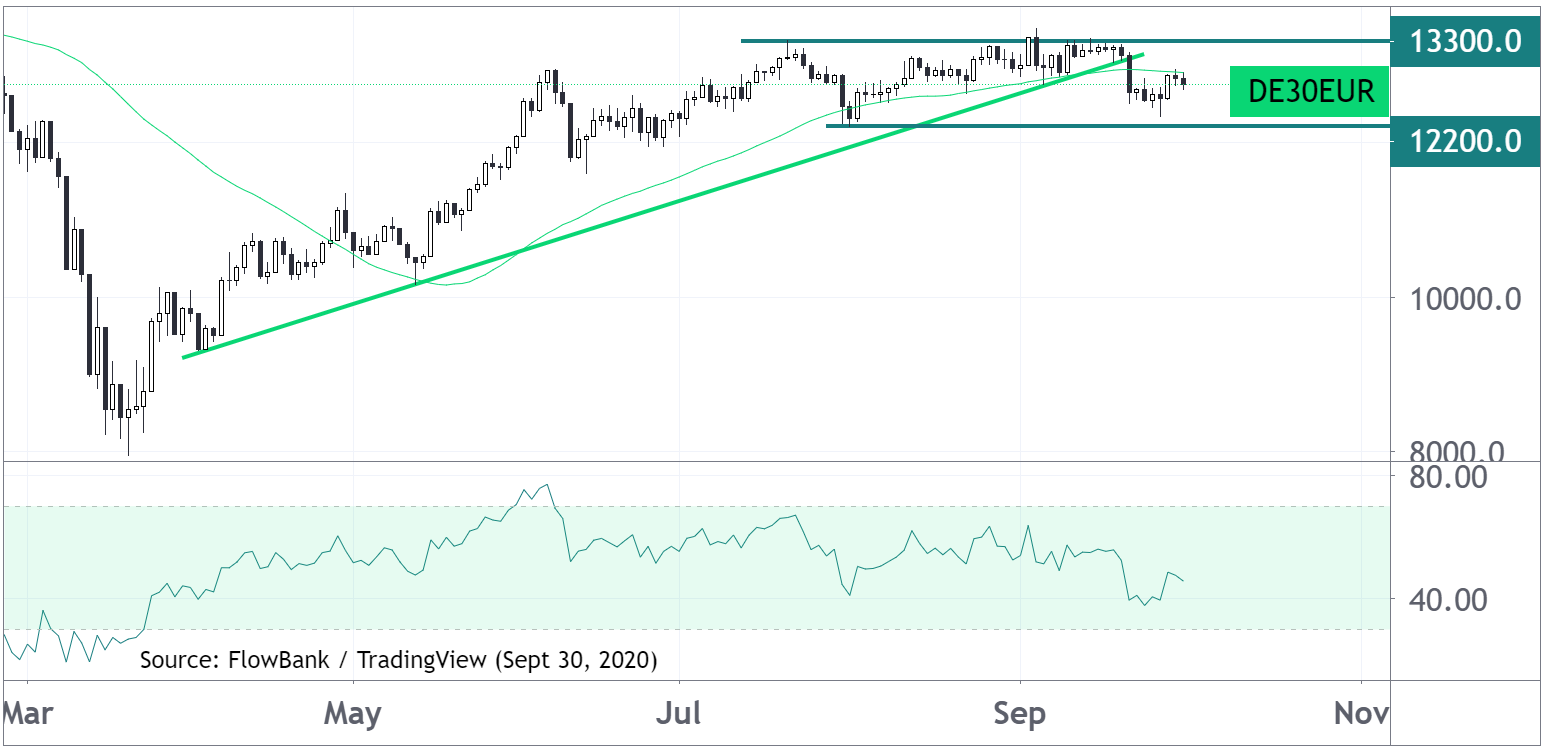
The DAX has found an interim top at 13,300. After breaking below the 50 DMA for the 2nd time as well as a rising trendline in place since April, the index price tested support at the July low near 12,200.