

The first module of “Technical Analysis demystified” was dedicated to major reversal patterns. In this Knowledge Series, we look at how to identify and use continuation patterns.
In this blog post, we look at continuation patterns through the lens of 3 different time horizon: 1-3 months, 3 weeks to 3 months and then 1 week to 5 weeks.
Time horizon: 1 to 3 months
Triangles
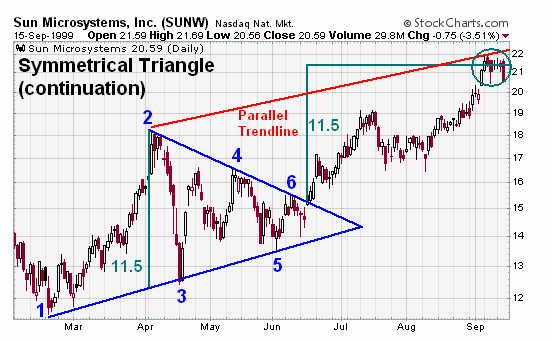
Symmetrical Triangle (or coil)
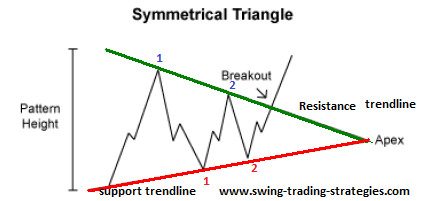
The symmetrical triangle, which can also be referred to as a coil, usually forms during a trend as a continuation pattern. The pattern contains at least two lower highs and two higher lows. When these points are connected, the lines converge as they are extended and the symmetrical triangle takes shape. You could also think of it as a contracting wedge, wide at the beginning and narrowing over time.
When volume decreases as the price swing narrows, the signification is neutral.
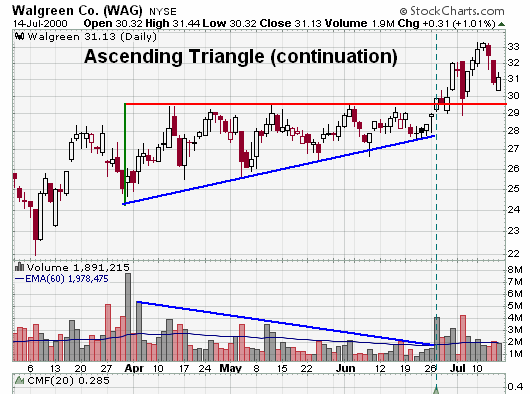
Right angle triangles (Ascending or Descending Triangle)
A descending triangle is bearish, an ascending triangle is bullish.
The ascending triangle is a bullish formation that usually forms during an uptrend as a continuation pattern. There are instances when ascending triangles form as reversal patterns at the end of a downtrend, but they are typically continuation patterns. Regardless of where they form, ascending triangles are bullish patterns that indicate accumulation.
Broadening formation: volume tend to increase
Rectangle formation
A rectangle is a continuation pattern that forms as a trading range during a pause in the trend. The pattern is easily identifiable by two comparable highs and two comparable lows. The highs and lows can be connected to form two parallel lines that make up the top and bottom of a rectangle. Rectangles are sometimes referred to as trading ranges, consolidation zones or congestion areas.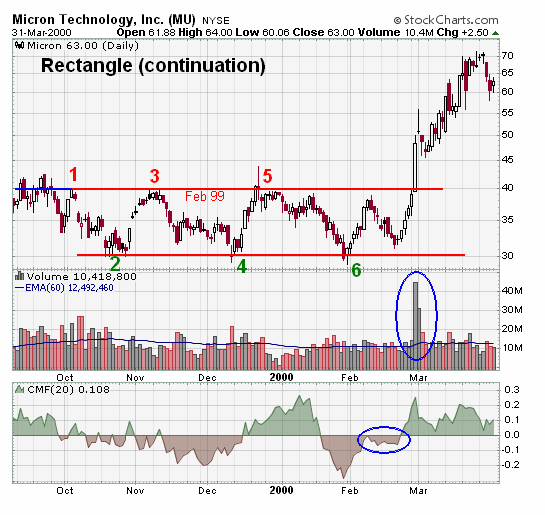
Time horizon: 3 weeks – 3 months
Wedge
It is similar to a symmetrical triangle but it goes against the prevailing trend. There is a noticeable slant.

Time horizon: 1 week – 5 weeks
Flag rectangle: 2 parallel lines that tend to slop against the prevailing trend
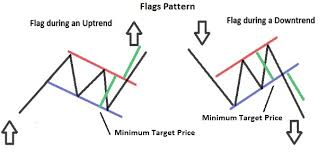
Bullish (and Bearish) pennant: 2 converging lines forming a small symmetrical triangle, being more horizontal than a wedge. Volume dries up during the Pennant formation.
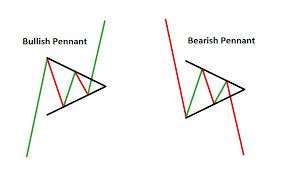
Measuring implications of these 2 patterns: they appear at the middle of the move
The apex of a triangular pattern is a time limit for the pattern and a point that helps to tome and measure the potency of the pattern. It is also an important support or resistance level after the breakout occurs.
Read our next article: Reasons the dollar could bottom out


