

Read the 10 stories to remember from the first quarter of 2021.
Story #1: Commodities & Equities outperformed fixed income.
The first quarter of the year was dominated by rising bond yields, a surge in commodity prices and a value-led equity market rally. The main drivers of this performance were the Democrat victory in Georgia at the start of the year, paving the way for a tsunami of liquidity, as well as the success of the vaccine rollout in the US and UK.
Overall, it was a bad quarter for government bonds/fixed income and a good quarter for commodities and most equity markets as the Dow and SPX surged to new highs. It is now just over a year since equity markets bottomed and MSCI world has rallied 79% since then and is 18% above its pre-Covid highs and up 5% year to date. The 10-year US Treasury yield now stands at 1.75%, vs. 0.5% at the low in August and 0.9% at the start of the year. For the 4th straight quarter, US stocks dramatically outperformed Treasuries. The S&P 500 gained over 6% as Treasuries Total Return fell over 4%.
Away from crypto (Bitcoin +101%, Ethereum +150%), the top performing asset was oil with a Q1 performance of +22.7% for Brent Crude and +21.9% for WTI. Oil is still in the lead in spite of the fact that both prices fell over the last month, as concerns over a rise in Covid cases at the global level led to renewed fears about further restrictions and reductions in mobility. Nevertheless, while oil is at the top of the DB YTD sample (see chart below), other commodities haven’t performed so well, with precious metals the worst, in a mirror image of returns last year.
Chart: Total return performance of major global financial assets in Q1 (in USD) – source: DB 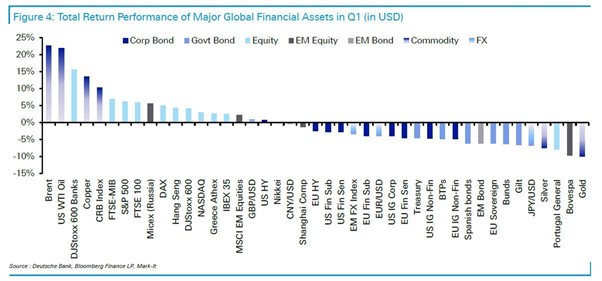
Story #2: The liquidity flood
Liquidity remains a major driver for risk assets performance. There is currently a tsunami of liquidity flowing the real economy and financial markets. When the Treasury reduces its cash, the funds immediately leave the FRBNY (Federal Reserve Bank of New York) and enter the economy. Historically these cash fluctuations were small. Now nearly $1 trillion is entering the US economy in a very short period of time. In addition, in July, Congress will again debate the debt cap expected to expire July 31, 2021. Further reductions of the TGA to under $500 billion are reasonable to consider.
Chart: The Treasury General Account (Source: CME Group)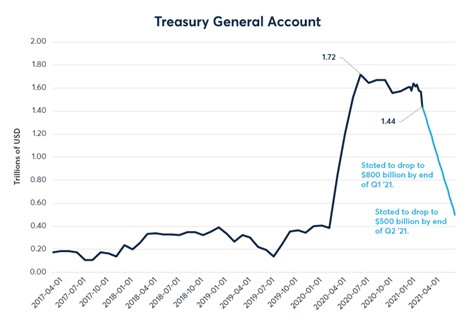
The stimulus at the end of 2020 ($900B) and the relief package signed in early March ($1.9T) equate to nearly 14% of US GDP. The American Jobs Plan announced on the last day in March proposes an additional $2.25 trillion in spending geared largely toward improving transportation, communication, and power infrastructure. The infrastructure plan will be paired with an additional $1 trillion in spending focused on social programs and is expected to be unveiled in April. Time will tell how much stimulus will be passed by Congress; however, overall fiscal spending is unprecedented and clearly larger than what markets were pricing at the start of 2021. To fund the infrastructure plan, the Biden administration suggested hiking the corporate tax rate to 28% from 21%, which one estimate indicated could cost 9% of next year’s S&P 500 earnings.
At the international level, we note that the aggregated G7 Central Banks balance sheets continued to expand throughout the first quarter. The combined effects of fiscal & monetary stimuli represent a major tailwind for financial markets.
Story #3: Vaccine, re-opening and Inflation fears
The largest vaccine rollout in history is underway, and already more than 590M doses have been administered worldwide. Bloomberg estimates more than 150M doses have already been given in the U.S., which exceeds the total number of positive cases since the start of the pandemic. The US administration hopes to have enough supplies available to all adults in the U.S. by the end of May. While global cases are on the rise, including a recent uptick in the U.S., the average rate of inoculation is vastly outpacing the rise in new cases. With over 37% of American and 58% of British adults now having received at least one dose of vaccine and the number of people being hospitalised with Covid much lower than at the start of the year, investors look ahead to a hopefully sustainable reopening of their economies.
However, some investors seem to be worried that the size of the US stimulus, combined with pent-up savings, could lead to a pickup in inflation, potentially leading the Federal Reserve to tighten policy to an extent that could be damaging for equity markets. However, despite upgrading its growth forecasts for this year and expecting unemployment to decline to 4.5% by the end of this year and 3.5% by the end of 2023, the Fed does not believe inflation will be sustainably above target and still expects not to raise rates before 2024.
As shown on the chart below, the market is now forecasting that U.S. inflation will run at 2.43% over the next five years, the highest rate of market-predicted inflation since the 5-year breakeven rate hit 2.63% on July 7, 2008. That was just before the housing market crash sent stock values plummeting. Five months later, on Nov. 28, 2008, the 5-year breakeven fell to -2.24%, a remarkable crash of 487 basis points. U.S. inflation is currently running at 1.4% and has been consistently below 2.0% since March 2020.
Chart: 5-year Inflation breakeven rate (souce: FRED) 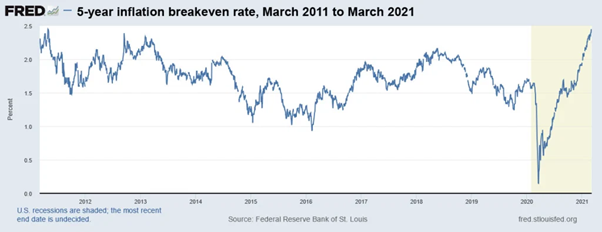
Story #4: Value & small caps outperformed Growth & Large Caps
The stocks that benefited most from Covid have been underperforming since November as the Covid losers have played catch up. Q1 continued the trend, which began in October with a rotation from Growth to Value and large-cap to small-cap.
The rise in bond yields in Q1 has been closely correlated with significant outperformance for financials and value stocks. Higher commodity prices have also helped value stocks, with oil up 22% and copper up 13% ytd. Small cap stocks, which tend to be more domestically focused, have performed particularly well.
For the quarter, the Russell Microcap (+23.9%), S&P Midcap 400 (+13.5%), and Russell 2000 (+12.7%) were the top performers. The Russell 1000 Value Index (+10.7%) outperformed the Russell 1000 Growth Index (+0.7%) by 9.9 percentage points, its largest outperformance in 20 years.
At the sector (US equities) level, Energy (+30.8%) and Financials (+5.8%) both exhibit double-digit performance since the start of the year. We note that Energy stocks still have a long way to go on a relative basis – see chart below.
Chart: US Energy stocks relative to S&P 500 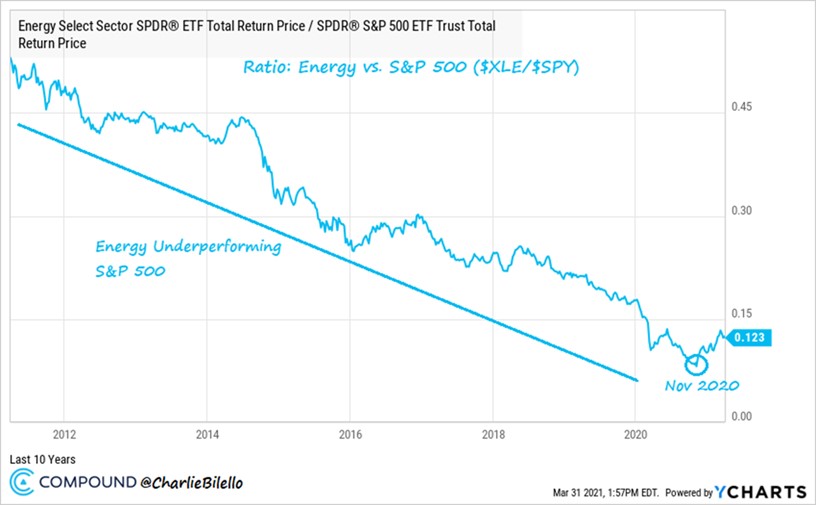
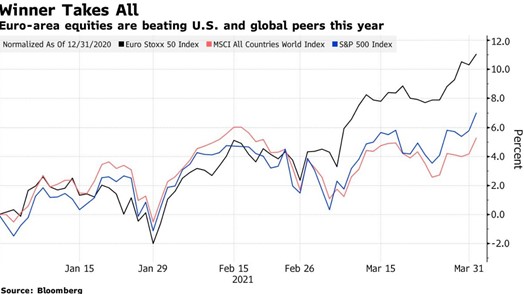
Story #5: European and Japan equities outperformed US and global equities
Even markets where the vaccine rollout has significantly lagged the UK and US have performed well. Eurozone equities are up 8% and thus outperforming US and global equities (see chart below) despite having vaccinated only 11% of its population. Japan equities also did well (+9%). Both have been helped by a strong rebound in global goods demand, and financials have benefited from steeper yield curves. Despite low vaccination rates, Japan has seen very few Covid cases, but Europe is seeing cases increase, which could delay the domestic recovery.
Chart: EuroStoxx50 vs. S&P 500 and MSCI World equities (source: Bloomberg)
Emerging market equities have had a difficult few weeks after a strong start to the year, ending the quarter up 2%. Chinese equities sold off from mid-February.
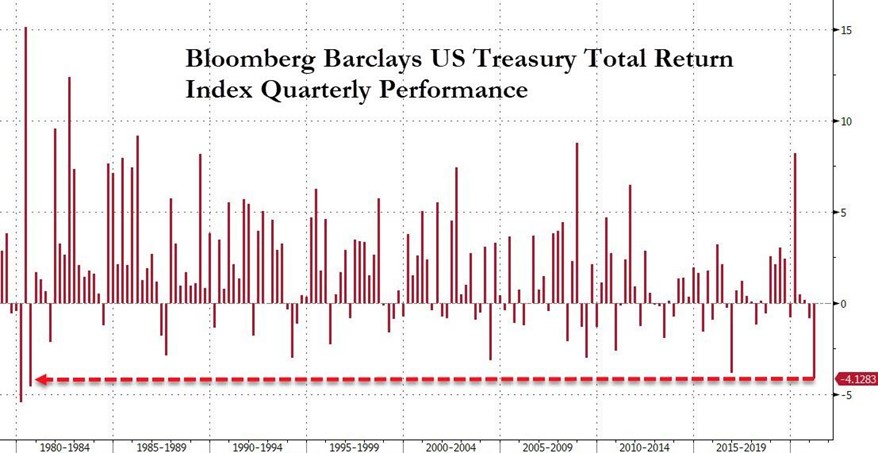
Story #6: US Treasury's Total Return in Q1 was the worst since Q3 1980.
Long rates exploded higher throughout Q1, with the UST 10YR Yield rising 15bps (Jan), 34bps (Feb), and 34bps (March). The 83bps rise in Q1 was the largest quarterly gain since Q4 2016 (85bps) and Q2 2009 (87bps). Accordingly, the yield curve steepened meaningfully with the 10YR-2YR UST spread widening by 79bs in Q1. While this is the highest rise since Q1 2008, which nearly marked the onset of the Great Recession, the prior highs occurred in the early 1980’s in the early stages of a historic bull market.
Chart: US Treasury's Total Return in Q1 was the worst since Q3 1980 (Source: www.zerohedge.com)
Story #7: Oil surged over 25% in Q1, its best quarter since Q2 2020.
Oil prices surged in the first quarter, largely erasing their coronavirus-related losses as traders position for a tighter market due to producers’ supply cuts and a sharp drop in industry investment.
World oil markets are rebalancing after the Covid 19 crisis spurred an unprecedented collapse in demand in 2020, but they may never return to “normal”, said the IEA.
Rapid changes in behavior from the pandemic and a stronger drive by governments towards a low-carbon future have caused a dramatic downward shift in expectations for oil demand over the next six years. This is forcing hard decisions on oil-producing countries and companies, which are reluctant to leave resources untapped or to install new capacity that would only sit idle.
The flip side is that we could see temporary under-supplied markets as demand recovers faster than expected.
Chart: WTI Crude Oil in Q1 (Source: www.zerohedge.com) 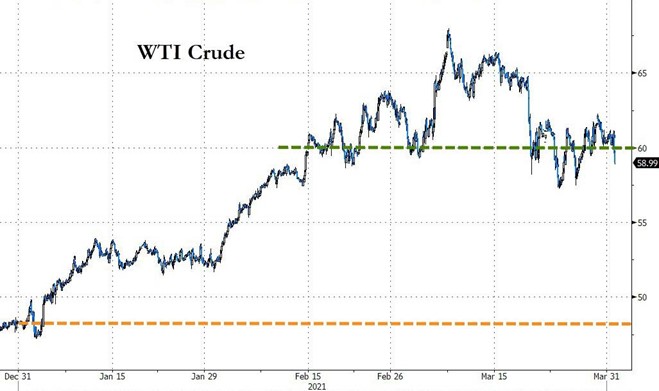
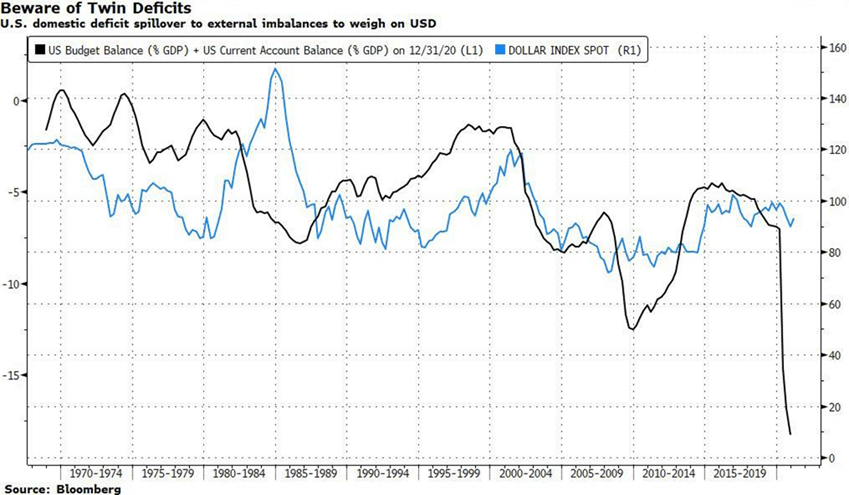
Story #8: After 3 straight quarterly losses, the dollar surged in Q1 to its highest since early November.
The US Dollar Index (DXY) rose for the third consecutive month for a gain of 2.6% in March. Similar to long rates, this was its best monthly performance since November 2016. The recent January low bottomed near the lows from 2018, yet the 12-month trend of lower highs is still in place. Price did recently move back above the 40-week SMA, so it is on watch to see what it can do from here.
On the bullish side, the dollar is benefiting from the uneven re-opening situation where the US is reopening much faster than in Europe as the vaccine rollout has been much quicker.
But there are also some bearish fundamentals for the dollar. Economies that have both a fiscal deficit and a current account deficit are often referred to as having "twin deficits." The United States has been in this category for years. And the picture has been worsening over the last few quarters. Would it lead to a collapse of the greenback?
Chart: US Twin deficits and the U.S Dollar
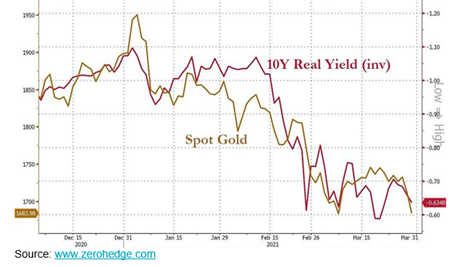
Story #9: Gold worst quarter since Q4 2016
Gold had its worst quarter since Q4 2016 (and its worst Q1 since 1982) as the precious metal plunged from almost $1960 at its early January highs to almost $1675 at its lows this week. It is Gold 10th quarterly decline of 10%+ since 1975. As real yields continue to push higher, gold is being dragged with it. We also note that some of the gold outflows are being redirected into cryptos (see next story).
Chart: Spot Gold vs. 10Y Real Yield (inverted) – source: www.zerohedge.com
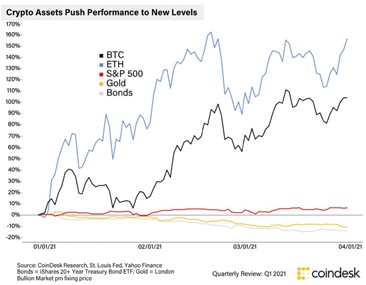
Story #10: Cryptos all soared in Q1
Bitcoin surged over 100% in Q1 - its 4th quarterly gain in a row; Ethereum exploded 150% in Q1 - its best quarter on record. Bitcoin’s total market value passed $1 trillion this quarter, making it an asset class worth looking at for many of the large institutions who previously ignored it because its market was too small. Total crypto market capitalization posts new all-time high above $1.9 trillion. Total crypto market cap briefly surpassed that of Saudi Aramco.
Chart: Crypto assets performance in Q1 vs. traditional asset classes (source: Coindesk)
Source: JP Morgan, Nasdaq, www.zerohedge,com, Coindesk, Bloomberg


