The Moving Average Convergence Divergence (MACD) is a powerful tool in a trader's arsenal, offering crucial insights into market momentum and potential trend reversals. This guide delves deeper into the intricacies of the MACD, starting with the calculation process, which involves the use of exponential moving averages and their differences.
A comprehensive understanding of the MACD signal line and the histogram is crucial, as this can illustrate the relationship between the two moving averages. Effective risk mitigation is a key aspect of any successful trading strategy, and this guide provides strategies designed to manage and minimise the risks associated with using the MACD. It also provides illustrative examples of trading strategies, showing how MACD can be implemented in various scenarios.
The guide further explores the use of MACD under different market conditions, and how its utility can be maximised to generate profitable trading signals. Lastly, it compares MACD with other popular technical indicators, further expanding on its benefits and drawbacks. This detailed examination of MACD aims to enhance your day trading capabilities and chart analysis proficiency.
Contents: Moving Average Convergence Divergence (MACD)
- What is MACD?
- How is MACD calculated?
- How to read the MACD indicator
- Understanding MACD signal line and histogram
- Drawbacks of using MACD
- How to mitigate risks when using MACD
- Examples of trading strategies using MACD
- Use of MACD in different market conditions
- Comparing MACD with other technical indicators
What is MACD?
The MACD indicator is a popular price indicator used for day trading and forex trading. It measures the difference between two exponential moving averages and plots the difference as a line chart. The difference between the MACD line and a second signal line is then plotted as an easy-to-interpret histogram.
Like all technical indicators, the settings of the MACD can be changed to different time periods but traders tend to prefer the defaults. The defaults are 12 and 26-periods for the EMAs, with the signal line as a 9-period EMA of the MACD line.
How is MACD calculated?
The Moving Average Convergence Divergence (MACD) is a momentum oscillator that reveals changes in the strength, direction, momentum, and duration of a trend in a stock's price. The MACD is calculated by subtracting the 26-period Exponential Moving Average (EMA) from the 12-period EMA. The result of that calculation is the MACD line. A nine-day EMA of the MACD called the "Signal line," is then plotted on top of the MACD line, which can function as a trigger for buy and sell signals.
How to read the MACD indicator
There are two important ways to read the MACD indicator.
- Whether market is overbought or oversold
- Whether the market is up-trending or down-trending ( A signal line crossover happens when the MACD line crosses below or above the signal line on the MACD histogram. It can either be a bearish divergence or a bullish signal)
Overbought / oversold ( Buy and Sell Signals)
This is a screenshot of the MACD indicator the way it is setup in the FlowOne trading platform. You can see that peaks in the MACD indicator match peaks in the price and toughs in the indicator match troughs in the price.
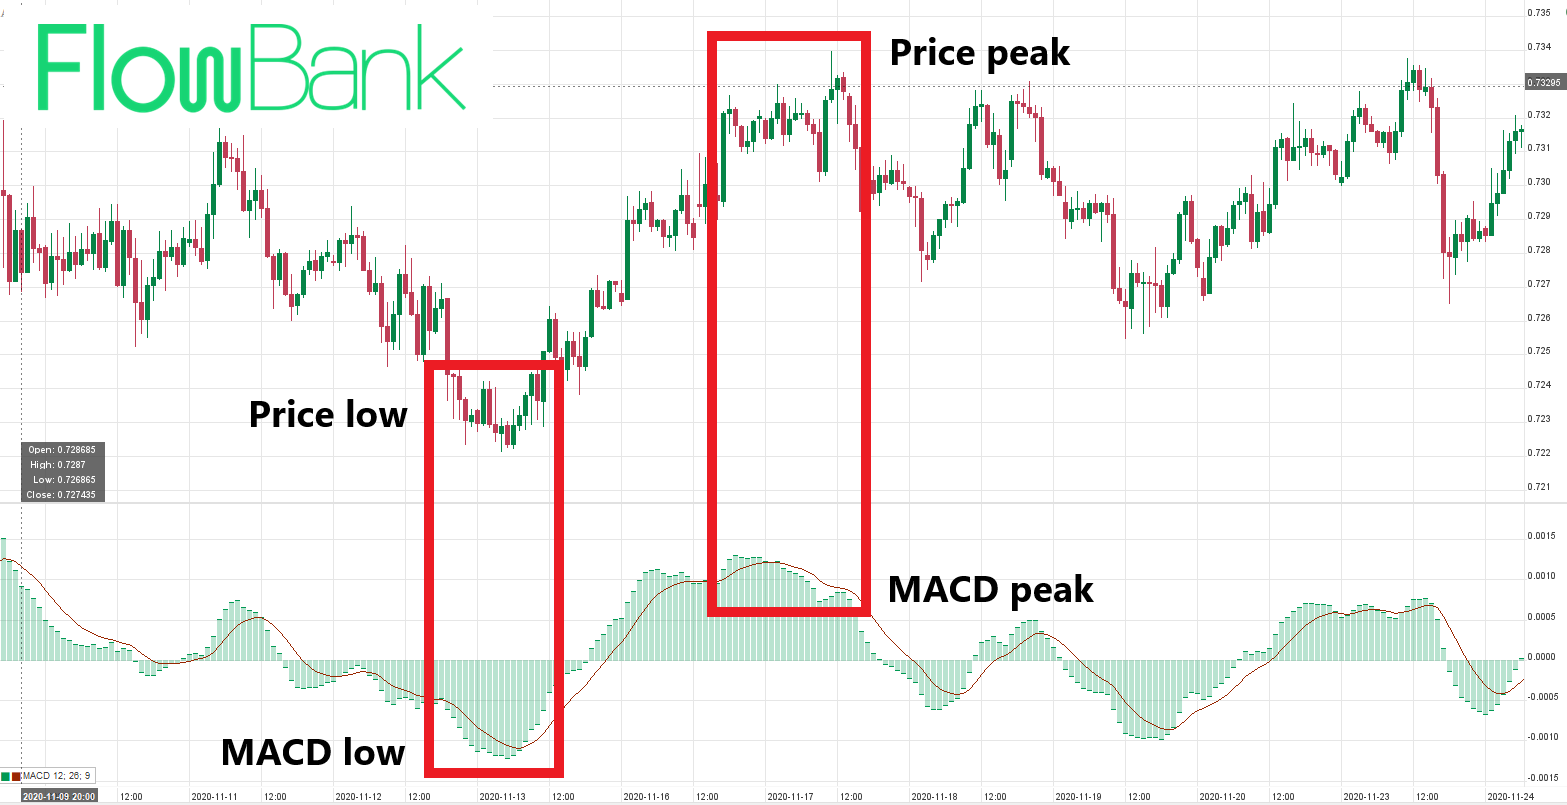
This is because the MACD tends to oscillate between positions of being overbought when it will form a peak to positions of oversold when it forms a low.
This is useful information for traders because the MACD indicator can show them when the price might be about to form a high or low. Traders would want to reduce long positions near the peaks and add to short positions, while reducing short positions near the lows and add to long positions. Therefore, it is crucial that you understand the MACD divergence.
Uptrend or downtrend
The MACD is not constrained between -1 and +1 like some technical indicators but it does have a zero line through the middle. When the MACD is above zero, the trader can interpret the price as moving higher in an uptrend (bullish divergence). While the MACD is below zero, the trader can consider the price as falling within a downtrend (bearish momentum).
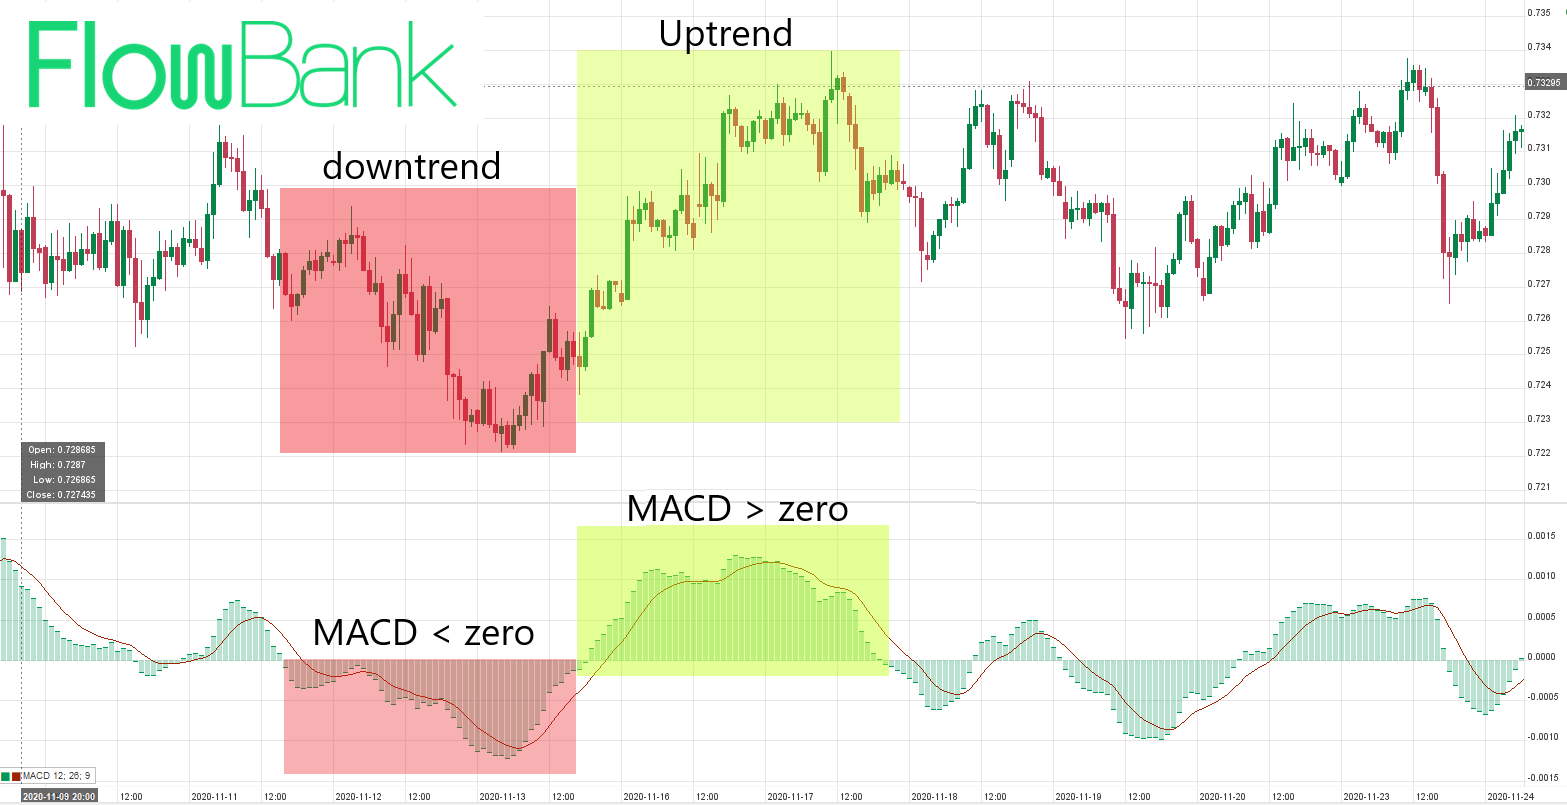
A trader can use this information on MACD divergence as part of a trading strategy to determine the direction of the market. Traders using a trend following system would only buy when there is a MACD line crosses above the zero line while traders using a mean reversion system would only sell. Likewise trend followers would want to sell while the MACD is below zero and counter trend traders would be looking for trading opportunities to buy.
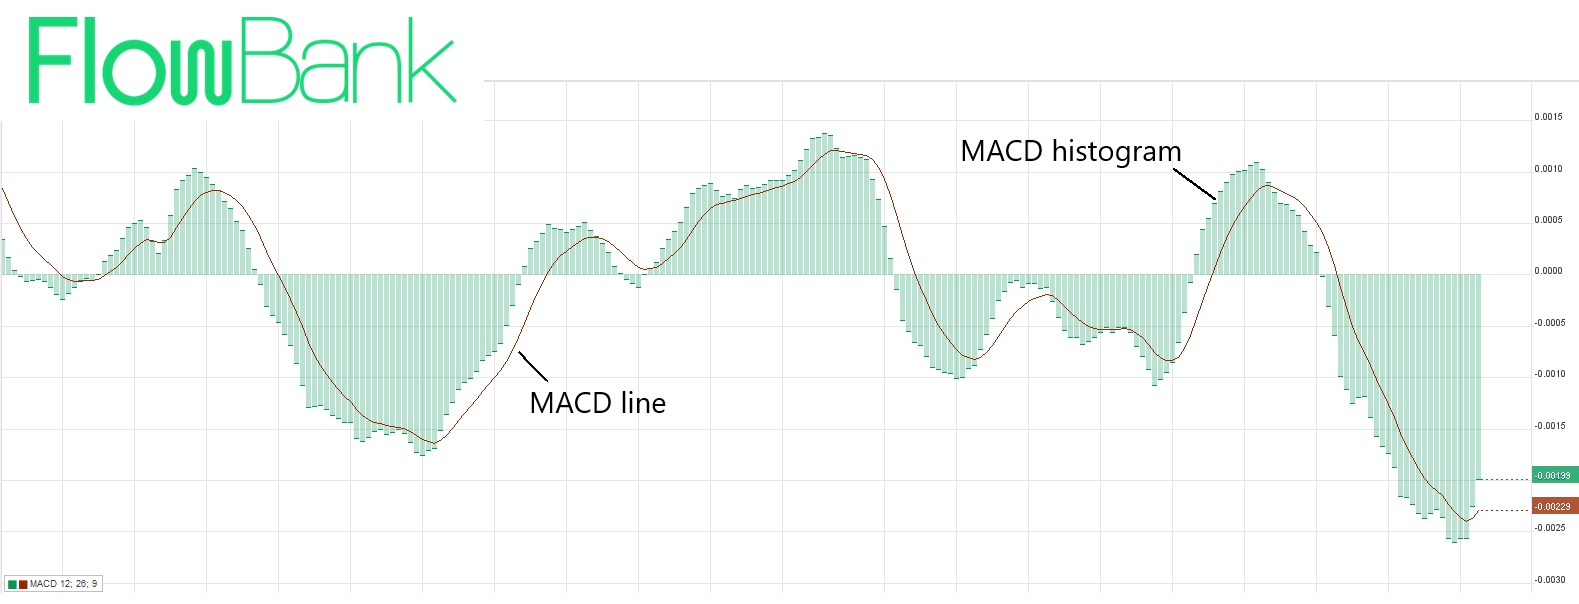
Understanding MACD signal line and histogram
The MACD signal line is the nine-day EMA of the MACD line. This line is used as a signal line and a trigger for buy and sell signals. When the MACD crosses above the signal line, it gives a bullish signal, indicating that it may be an appropriate time to buy. Conversely, when the MACD crosses below the signal line, it gives a bearish signal, indicating that it might be an appropriate time to sell.
The MACD histogram is an elegant visual representation of the difference between the MACD and the signal line. When the MACD is above the signal line, the histogram will be above the MACD's baseline. When the MACD is below the signal line, the histogram will be below the MACD's baseline.
Drawbacks of using MACD
Each of the two ways of interpreting the MACD have their disadvantages.
- By the time the MACD crosses above the zero line, the price is normally well above the bottom. Equally when the MACD crosses below the zero line, the top has normally already happened. Using the zero level of MACD is a lagging indicator for the price - meaning you get the indicator signal after the price has changed direction.
- When the MACD reaches an overbought level, the price can remain in an uptrend for a significant period afterwards. Similarly, when the MACD reaches an oversold level, the downtrend can continue for a longer period afterwards.
There are ways to mitigate these downfalls of the MACD such as waiting for the MACD to go overbought or oversold for a second time - forming its own double top. Or by only trading in the direction of a longer term trend, as done in the following example strategy. Furthermore, you can use other technical analysis as MACD is a short-term indicator.
How to mitigate risks when using MACD
- Avoid false signals: MACD, like all indicators, can produce false signals. Traders should use other technical analysis tools and their discretion to avoid false buy or sell signals.
- Understand market conditions: MACD works best in volatile markets. In less volatile markets, the MACD may produce false signals.
- Use stop loss orders: To limit potential losses, traders can use stop loss orders. If the trade moves in the opposite direction, the stop loss order can limit the loss.
Use of MACD in different market conditions
In trending markets, traders can use MACD to identify potential buy and sell points. When the MACD line crosses above the signal line during an uptrend, it's a bullish signal, and when it crosses below during a downtrend, it's a bearish signal. However, during range-bound markets, MACD can produce many false signals and can therefore be less useful.
An example MACD trading strategy
One popular strategy is the "MACD crossover". When the MACD line crosses above the signal line, traders buy the asset. Conversely, when the MACD line crosses below the signal line, they sell it. Another strategy is the "MACD histogram reversal". Traders look for the MACD histogram to change direction. If it were falling and then started rising, traders would buy. Conversely, if it were rising and then started to fall, traders would sell.
The rules of any day trading system must be clearly defined and easy to follow. This systems is known as the MACD crossover. The rules to this example trading system are as follows:
LONG/SHORT: Take long MACD signals when price is above the 200 period-moving average
ENTRY: Buy when the MACD crosses over the zero line
EXIT: Sell at a profit or loss when the MACD crosses below the zero line
Here you can see an example of the strategy at work:
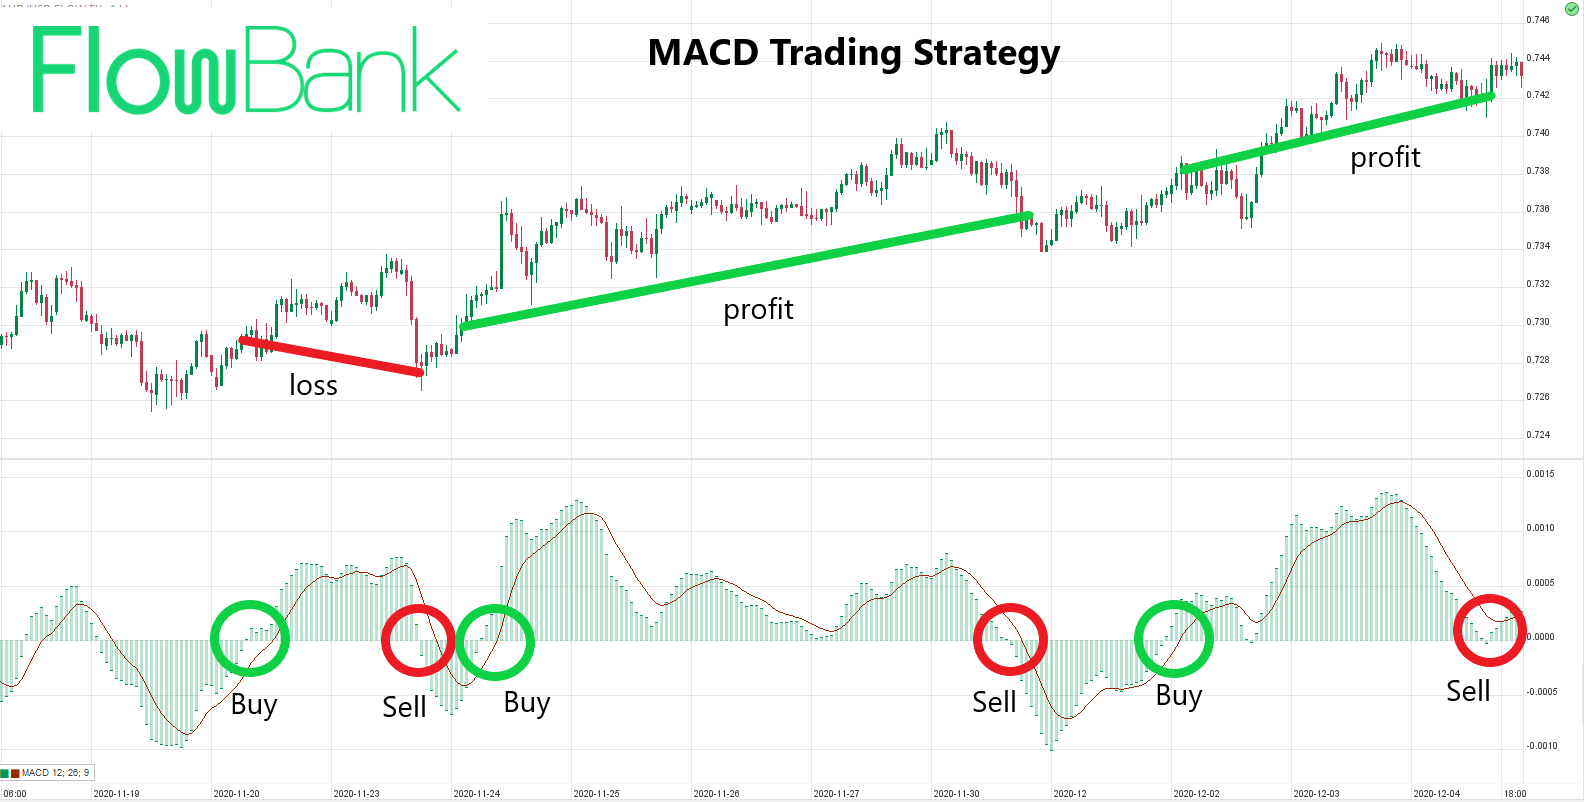
How this system works is that it aims to buy when the MACD confirms the price is moving from a down-trending environment to an up-trending environment. It then aims to ride this uptrend as long as possible before selling when the MACD signals the price is moving back into a downtrend. There is also the additional criteria that the price should be above the 200-period moving average to avoid taking trades against the direction of the major trend.
This is the outlines of a trading strategy that does not include important elements like which markets and timeframes to trade and risk management rules such as cutting losses over a certain size etc. The strategy can apply to any market, timeframe, or risk management strategy so long as the rules are consistently followed.
Comparing MACD with other technical indicators
Like other momentum indicators such as the Relative Strength Index (RSI) and the Stochastic Oscillator, MACD can help traders identify overbought and oversold conditions. However, unlike these indicators, MACD does not have an upper or lower limit, which makes it less effective at identifying extreme conditions. MACD's strength lies in its ability to identify and follow trends.