Trendlines are a fundamental tool in the realm of trading, often leveraged by both beginners and seasoned traders alike due to their simplicity and effectiveness. They represent the trajectory of a financial market, helping to illustrate the overall direction of the price movement, be it upwards, downwards or sideways.
More importantly, trendlines are a visual representation of supply and demand, providing valuable insights into market sentiment and potential shifts in market trends. Understanding the basic principles of trendlines can be instrumental in identifying potential trade signals and even more critical, discerning when a trendline is valid. This can be especially crucial in volatile markets such as the stock market or commodity trading, where trendline analysis can help mitigate risk and maximize profits.
Nevertheless, as with any trading tool, trendlines come with their own set of advantages and disadvantages, and it's essential for traders to understand these to effectively utilize them in their trading strategies. Furthermore, understanding trendline breakouts and breakdowns can offer additional insights, enabling traders to navigate the often unpredictable financial markets with more confidence. The following sections will explore these topics in more detail, supplemented by real-life case studies of trendline trading.
Contents: Trendline in trading
- What is a trendline?
- Importance of trendline in trading
- The basic principles of trendline
- How to identify potential trade signals with trendlines
- How does a trendline work?
- When is a trendline valid?
- Types of trendlines: Uptrend, Downtrend and Sideways trend
- How to draw a trend line
- Trendline and Chart Patterns
- How to use trend lines in trading
- Advantages and disadvantages of using trendlines in trading
- SPECIAL TIPS for using Trendlines
- Trendline Breakouts and Breakdowns
- Forex trend line analysis
- Stock market trend line analysis
- Commodity trading and trendline analysis
- Trendline trading strategies
- Case studies of trendline trading
What is a trendline?
A trendline is a line drawn through a chart to show the trend. In the context of trading, trendlines are drawn on price charts to show the trend in the price. Traders use this information to determine whether to buy or sell in the direction of the trend. Trendlines can be used for a stock price or forex currency pair or cryptocurrency. Trend lines are one of the best-known price action indicators used in technical analysis.
Importance of trendline in trading
Trendlines are one of the most fundamental aspects of technical analysis used in trading. They are used to represent the direction of a trend, whether it's upward (bullish), downward (bearish), or moving sideways. By observing the trendlines, traders can make informed decisions about when to enter or exit a trade. Trendlines can also serve as a critical support or resistance level.
The basic principles of trendline
Trendlines are created by connecting two or more price points on a chart. The more points connected, the stronger the trendline becomes. Here are some key principles to consider when drawing trendlines:
- Respect of the line: A valid trendline should be respected by the price action.
- The steepness: An overly steep trendline is less reliable and can break easily.
- Breaks: A break in the trendline can signal a potential trend reversal.
How to identify potential trade signals with trendlines
Traders can identify potential trade signals by observing the price action in relation to the trendline. Here are some common scenarios:
- Trendline Bounce: When the price bounces off the trendline, it can be a signal to enter a trade in the direction of the trend.
- Trendline Break: A break through the trendline can indicate a possible trend reversal.
- Trendline Re-test: After breaking through a trendline, the price may re-test the line before moving in the direction of the new trend.
How does a trendline work?
The classic way to draw trendline is by drawing a straight line connecting a series of swing highs or swing lows. An up-trend line is drawn through the swing lows and a down-trendline is drawn through the swing highs. In that way the trendline is acting as support to an uptrend or as resistance to a downtrend. Trendline are often referred to as ‘dynamic support & resistance’ meaning that they move with the price trend.
When is a trendline valid?
A trendline is considered valid when it has at least three touch points. These touch points are instances where the price of a security touches the trendline without breaking through it. The more touch points a trendline has, the stronger and more significant it is considered to be. A valid trendline can act as a line of resistance or support for the price of a security, and it can signal potential buy or sell opportunities to traders.
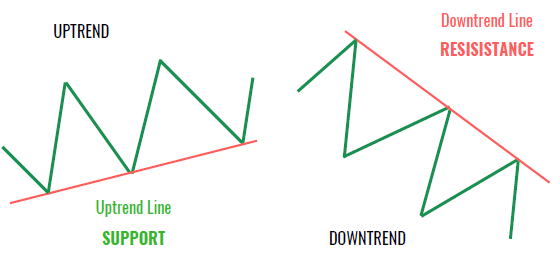
Types of trendlines: Uptrend, Downtrend and Sideways trend
- Uptrend: This is when the price of a security is generally moving upward. The trendline in this case is drawn below the price action, acting as a line of support.
- Downtrend: This is when the price of a security is generally moving downward. The trendline is drawn above the price action, acting as a line of resistance.
- Sideways trend: This is when the price of a security is moving sideways, neither up nor down. The trendline in this case can act as both resistance and support at different times.
How to draw a trend line
The way you draw a trendline is by starting on the Lefthand side of the chart and drawing the line towards the right. The rule of thumb is that a trend line must be drawn through at least three ‘swings’ in the price to be valid.
To draw an uptrend line, you start with a swing low on the left-hand side of the chart and connect it to a higher swing low.
To draw a downtrend line, you begin with a swing high on the Lefthand side of the chart and connect it to a lower swing high.
Trendline and Chart Patterns
Trendlines are essential tools in identifying chart patterns which are graphical representations of market movements. Common chart patterns include head and shoulders, double tops and bottoms, wedges, and triangles. These patterns can indicate a continuation or reversal of a trend. Trendlines help traders to spot these patterns and trade accordingly.
How to use trend lines in trading
How do you trade a trend line? The idea of using a trend line is to determine the direction of the price trend. Traders can then to decide with the trend with the idea that the trend will continue or against the trend because they think the trend will reverse. With both strategies, the interpretation of the trendline is the same
- While the price is above the uptrend line the trend is up, which is bullish.
- While the price is below a downtrend line, the trend is down, which is bearish.
Advantages and disadvantages of using trendlines in trading
Advantages: Trendlines can help traders identify the overall trend of a market, potential entry and exit points and price targets. They are simple to use and understand, and can be used in combination with other technical analysis tools to enhance trading decisions.
Disadvantages: Trendlines are subjective. Different traders might draw different trendlines for the same chart. They are also not always accurate. Sometimes, price can break a trendline only to reverse back to the original trend.
Trend following
Trend following is a trading strategy that buys when the price is rising and sells short when the price is falling. One popular trading method to determine whether the overall price trend is higher is by using an uptrend line. Likewise, a downtrend can be determined by using a downtrend line.
Countertrend trading
Countertrend trading is a strategy that sells when the price is rising and buys when the price is falling. This closer to the basic principle of investing to ‘buy low and sell high’. For short term traders, the reason to countertrend trade is with the idea of a reversion to the mean, meaning that after trending in one direction, the price will eventually return to is average price.
SPECIAL TIPS for using Trendlines
1 Is there a trend?
The ultimate newbie mistake with trendlines that you want to avoid is using a trendline when there is no trend. The clue is in the name!
Looking at this chart below - the market is just going sideways. It is therefore no surprise that all these trendlines don’t work.
 Source: Action Forex
2 Trendline Angles
Some platforms have a trendline tool, which shows you the angle of the line. In MT4 (Metatrader 4) this is known as ‘Trendline by Angle’. The perfect trendline is about 45 degrees. More than 45 degrees means the price is rising too quickly and is liable to easily break the trendline, even if the trend continues. Less than 45 degrees means the trend is weaker, almost trading sideways.
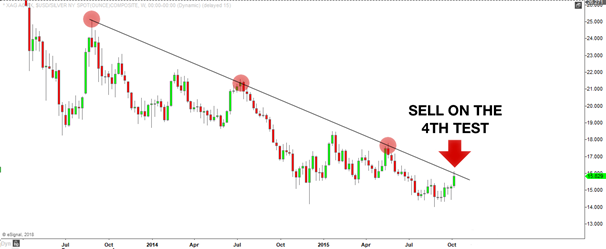
3 Number of touches
The more swing points that a trendline goes through, the stronger the trendline because it becomes more recognisable to more traders. BUT after five touches, the chance of the trendline ‘breaking’ increases significantly.
4 Zoom out
Remember to zoom out your chart in your trading platform so that you see the start of the trend you are trying to represent with the trendline. For example, if drawing an uptrend try to find the low of the previous downtrend and start your trendline there, or perhaps the next the swing low.
5 Trendline zones
Trendlines are not an exact science! It is rare that the price will perfect touch a trendline and then reverse. The trendlines should be considered an ‘area’ rather than a precise price point. Understanding this helps with determining your entry price and stop loss.
Trendline Breakouts and Breakdowns
A trendline breakout occurs when the price of a security breaks above a downward trendline in a bullish signal, or below an upward trendline in a bearish signal. A trendline breakdown is when the price of a security falls below a support trendline, potentially indicating a shift from an uptrend to a downtrend.
Forex trend line analysis
Trendline as especially popular in forex trading as well as cryptocurrency trading because technical analysis overall is used more than fundamental analysis among individual traders. Forex markets are driven by changes in interest rates, but the interest rates set by central banks rarely change. This means prices move according to traders’ expectations of interest rates, which is a lot harder to read. Technical analysts argue that the most consistent way to read the sentiment of the traders is through the price action and with analytical tools like trendlines.
Stock market trend line analysis
Trendline analysis is a key technique used by traders in the stock market. By drawing trendlines on a stock chart, traders can identify potential resistance and support levels, predict future price movements, and make informed trading decisions.
Commodity trading and trendline analysis
Just like in stock trading, trendline analysis is also widely used in commodity trading. Whether it's oil, gold, or wheat, understanding trendlines can help traders anticipate price movements and make profitable trades.
Trendline trading strategies
There are many ways to use trendlines but here we explain the two most common trendline trading strategies as well as a lesser known but very effective third option.
1) Trendline bounce
The goal of this strategy is to trade with the trend that is being supported by the trendline. Either buying close to an uptrend line or selling close to a downtrend line.
Strategy steps:
- Establish price trend: Up, down or sideways
- Draw a trendline with at least three connecting swing points
- Extend the trendline into the future
- A) Wait for the price to touch the trendline on another occasion
- B) Set a limit order at the trendline (adjust as price moves)
- Enter a trade in the direction of the trend when price has touched the trendline
- Place a stop-loss order under the previous swing low in an uptrend (above the previous swing high in a downtrend)
- Set a take profit order at least 2:1 the size of the stop loss
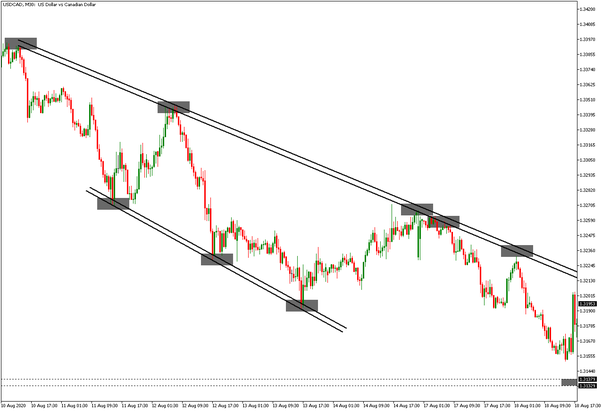
Chart example:
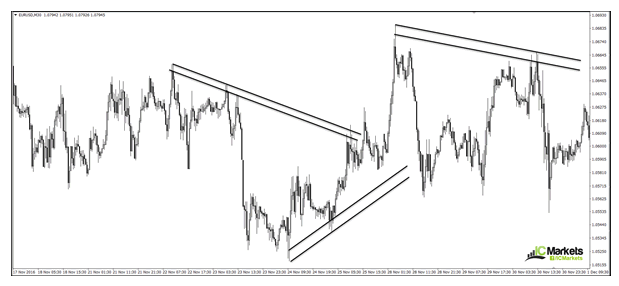
2) Trendline breakout
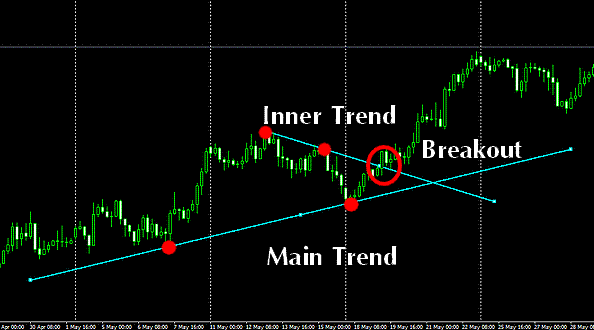
The trendline breakout can be used as a form of countertrend line trading, but that’s not what we are advocating here. How can a trendline break be a trend following strategy? It’s done by trading the breakout of short-term trendlines in the direction of the bigger trend!
Strategy Steps:
- Establish long term trend
- Wait for price to ‘correct’ or go against the long term trend
- Draw a trendline for this short term correction
- Wait for the price to breakout past this trendline
- A) Buy at the break of a downtrend line or sell at the break of an uptrend line
- B) Set a stop order past the trendline to enter on the breakout
- Set your stop loss on the other side of the trendline
- Set a take profit order at least 2:1 the size of the stop loss
Chart example:
Source: Forex Strategy Resources
3) Trendlines with confluence
Trendlines are a powerful tool but no one technical indicator or price action trading system is perfect. You will always increase your probability of success on a trade by incorporating more than one analysis technique and waiting for opportunities when the methods all conclude the same.
For example:
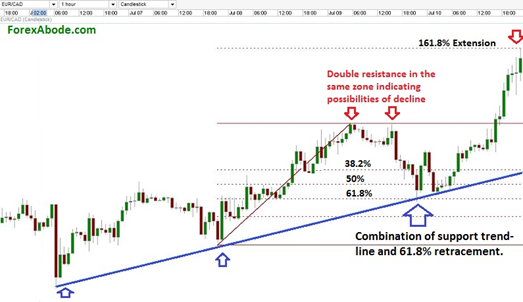
Trendlines with Fibonacci retracement
In this example an opportunity to buy at a rising trendline is corroborated by an opportunity to buy at the 61.8% Fibonacci retracement level.
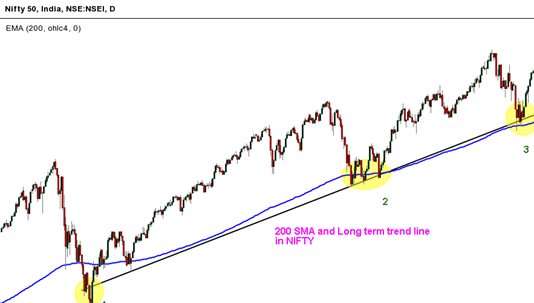
Trendlines with moving averages
Here a rising trendline matches the widely-watched 200-day moving average.
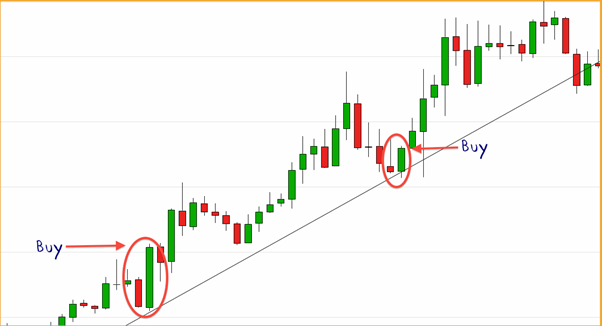
Trendlines with Japanese candlestick patterns
Here trendline bounces are supported by bullish engulfing candle patterns.
To practise drawing and trading with trendlines, register for a free FlowBank demo trading account
Case studies of trendline trading
Case studies can provide valuable insights into how trendline trading works in real-world scenarios. These studies can highlight how traders use trendlines to identify trading opportunities, manage risk, and achieve their investment goals.