


Forex trading signals are essential instruments for traders, acting as beacons in the vast and sometimes tumultuous ocean of the foreign exchange market. These signals are meticulously generated through rigorous analysis of market data, encompassing both technical and fundamental aspects of trading. They offer a snapshot of potential future movements in currency pair prices, providing traders with actionable intelligence.
Types of Forex trading signals
- Technical Signals : Derived from the statistical analysis of past market data, including price movements and volume. These signals often employ various technical indicators, such as moving averages, Relative Strength Index (RSI), and Fibonacci retracements, to predict future market behavior.
- Fundamental Signals : Based on economic indicators, political events, and financial news, fundamental signals reflect the underlying health and potential shifts in global economies. They require an understanding of macroeconomic principles and their impact on currency values.
- Sentiment Signals : These signals gauge the general mood of the market, derived from an analysis of the positioning and behavior of traders. Sentiment signals can be a powerful indicator of potential market reversals or continuations.
By analyzing positioning and market behavior, these signals offer a unique perspective on potential market reversals or continuations, enhancing the strategic toolkit available to FlowBank users.
What Are Forex Trading Signals ?
Forex trading signals are akin to navigational aids in the complex world of foreign exchange trading. They are expertly crafted alerts that offer timely advice on when to buy or sell specific currency pairs, aiming to optimize the profitability of trades. These signals are not just arbitrary suggestions but are based on meticulous analysis of market trends, economic indicators, and technical data. They serve as invaluable tools for traders at all levels of expertise, providing insights that guide trading decisions.
- For experienced traders : Consider the analogy of a seasoned chef working in a kitchen brimming with ingredients, each representing a different trading opportunity. In this scenario, forex signals act as timely recipe suggestions that pop up, offering ideas for new dishes that could potentially become the market's next favorite. These signals provide seasoned traders with fresh perspectives, encouraging them to explore new strategies that align with market dynamics.
- For novice traders : For those new to forex trading, signals can be likened to a GPS navigation system guiding you through unfamiliar terrain. They offer clear directions on when to buy or sell, helping you navigate towards your profit goals efficiently while also enhancing your understanding of the trading landscape. This guidance is crucial for building confidence and skill in trading decisions.
- The importance of timing : In forex trading, timing is everything. Acting on a signal too late is akin to missing a scheduled bus—it means missing out on potential profits due to the rapid pace at which the forex market operates. Prompt reception and action on signals are crucial for capitalizing on trading opportunities.
- Receiving Signals : Forex signals can be delivered through a variety of channels, ensuring traders remain well-informed and ready to act. Whether through email, smartphone notifications, or social media, these alerts ensure that you have immediate access to trading insights, much like staying updated with news through various platforms.
Types of signals :
- Manual Signals : Imagine a seasoned trader analyzing the market's movements and trends, much like a master craftsman assessing the quality of materials before making a piece of furniture. They use their expertise and judgment to generate signals, offering a personalized touch.
- Automated Signals : These are generated by algorithms or robots, akin to a smart home system that automatically adjusts the lighting and temperature based on time of day and outside conditions. Automated signals remove emotional bias, providing fast, data-driven suggestions.
Sources :
- Professional traders : Receiving signals from experts is like getting cooking tips from a chef; their experience can lead to tastier meals (or more profitable trades).
- Trading algorithms and software : Utilizing automated systems for signals is similar to using a fitness app for personalized workout plans—efficient, customized, and based on data.
- Social trading platforms : These platforms allow traders to follow and copy the trades of others, akin to using a popular recipe app where you can see and replicate what others are cooking up.
FlowBank trading signals
FlowBank stands out in the foreign exchange market by offering meticulously crafted forex trading signals, directly accessible through its user-friendly platform. These signals, blending technical, fundamental, and sentiment analyses, serve as crucial guides for traders navigating the complexities of currency trading.
Traders can find these valuable signals by clicking on the three lines to access the menu, then navigating to "Private" followed by "Market News" and "Technical Analysis."
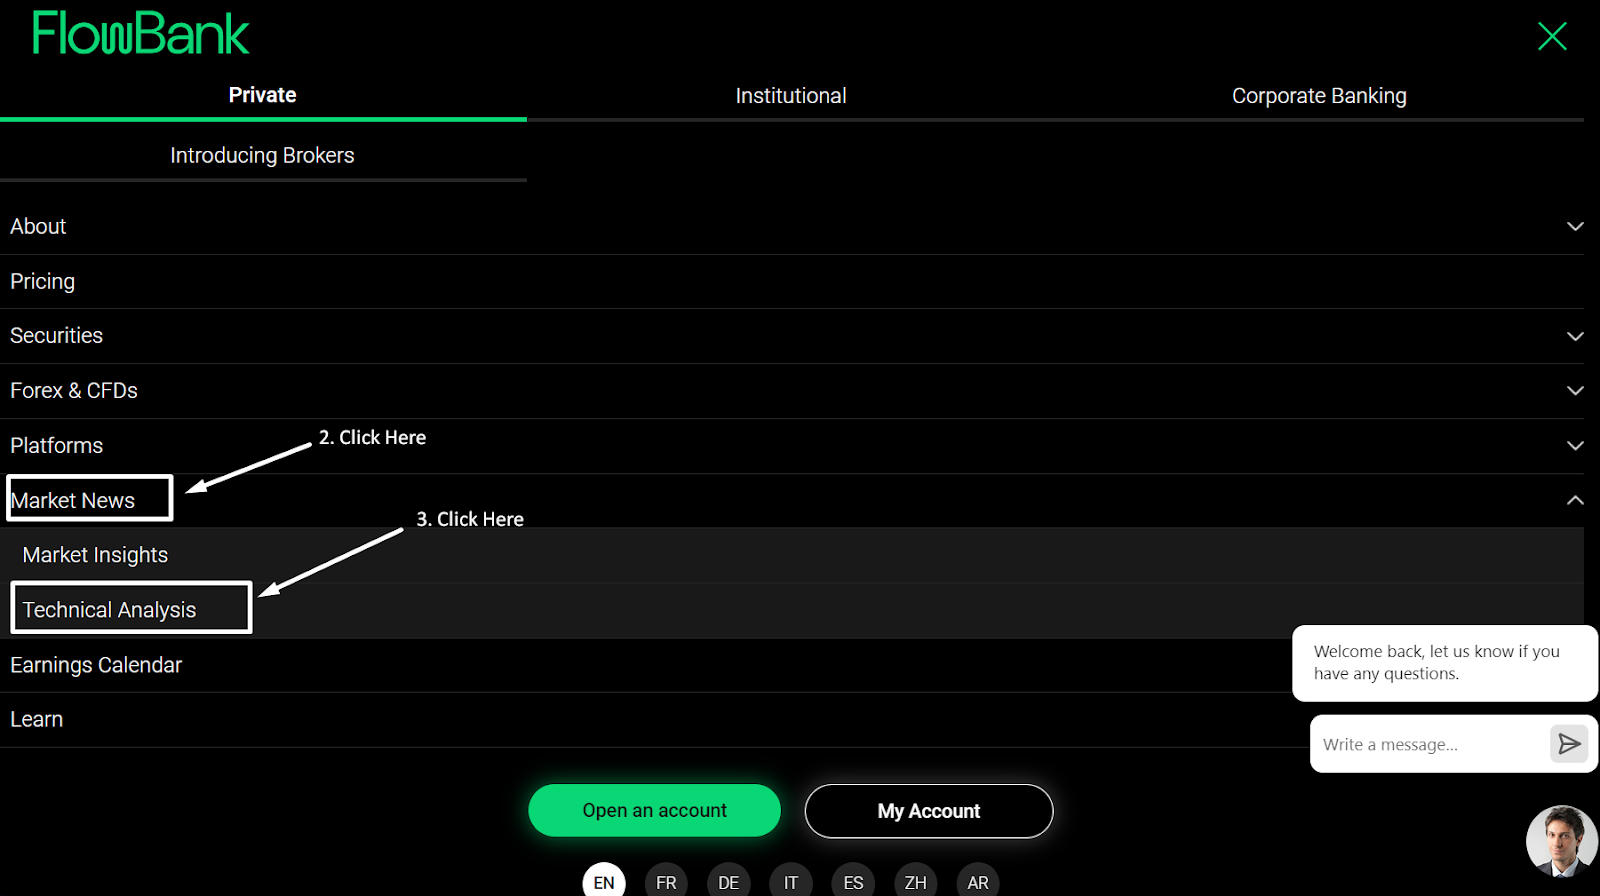
This structured approach allows users to effortlessly access FlowBank's expert trading insights, empowering them with the knowledge to make informed decisions. With FlowBank, traders have a trusted partner in their forex trading journey, offering them the signals and insights needed to navigate the market successfully.
For example : Imagine receiving a signal to buy EUR/USD at 1.1150. This alert arrives just as market trends begin to indicate an upward movement. By acting on this signal and executing the trade at the suggested entry point, you position yourself to profit from the anticipated rise in the pair's value.
Incorporating signals into Trading : Forex signals can enhance trading strategies, providing market insights and trade suggestions. For beginners, they act as mentors, while for experienced traders, they offer new perspectives. Choosing reliable sources and aligning signals with trading style and goals is crucial.
Interpreting Forex trading signals
FlowBank excels in providing these signals, equipping traders with the necessary information to navigate the forex landscape effectively. Understanding the key components and how to read these signals is crucial for maximizing trading strategies.
Key components of a Signal
- Price : The specific price point to enter or exit a trade.
- Action : Whether to buy (long) or sell (short) the currency pair.
- Stop-Loss : A predetermined level to exit a losing trade to minimize losses.
- Take-Profit : The target price level to exit a profitable trade.
Reading signal indicators
- Entry vs Exit Signals : Distinguishing between signals for entering or exiting the market is vital. Some services provide exclusively entry or exit signals, while others cover both, especially for short-term trades that incorporate detailed strategies for both initiating and closing trades.
- Interpretation : Understanding the signal's context, such as the currency pair's current market trend and potential economic events affecting it, enhances decision-making.
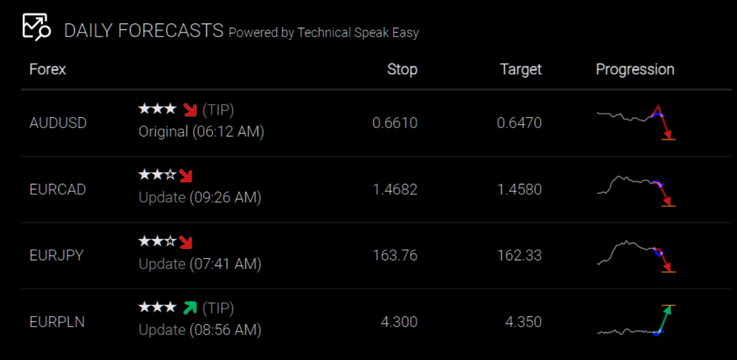
FlowBank Example :
.png?width=616&height=685&name=graph%20lundi%201%20(1).png)
- Forex Pair : AUDUSD
- Signal Type : Sell (Downward Arrow)
- Original Signal Time : 06:12 AM
- Entry Price : 0.6580
- laventStop-Loss : 0.6470
- Target (Take-Profit) : 0.6610
- Progression : Indicates ongoing monitoring and potential updates based on market movement.
FlowBank's approach to forex signals includes comprehensive details like entry price and stop-loss levels, ensuring traders have clear guidelines for trade execution. This structured information helps traders make informed decisions, balancing risk and potential reward in the volatile forex market.
The role of technical analysis in generating signals
Technical analysis employs chart patterns, indicators like RSI and MACD, along with support, resistance, and Fibonacci levels to craft precise forex trading signals.
Support and resistance : Deciphering Market Psychology
Technical analysis serves as a beacon in forex trading, illuminating potential market directions through historical price action. Support and resistance levels are pivotal to this analysis, demarcating zones where market psychology shifts palpably. The USD/SGD chart offers a vivid illustration :
- Support at 1.31600 showcases a battlefield where buyers consistently rally, repelling bearish advances and propelling prices upward.
- Resistance at 1.37506 outlines the front where sellers mount a robust defense, capping bullish aspirations.
Centrally placed, the pivot point at 1.33979 is the equilibrium frontier — a green line demarcating a balanced tug-of-war between buyers and sellers. Prices above this fulcrum suggest a bullish charge, while below, a bearish retreat.
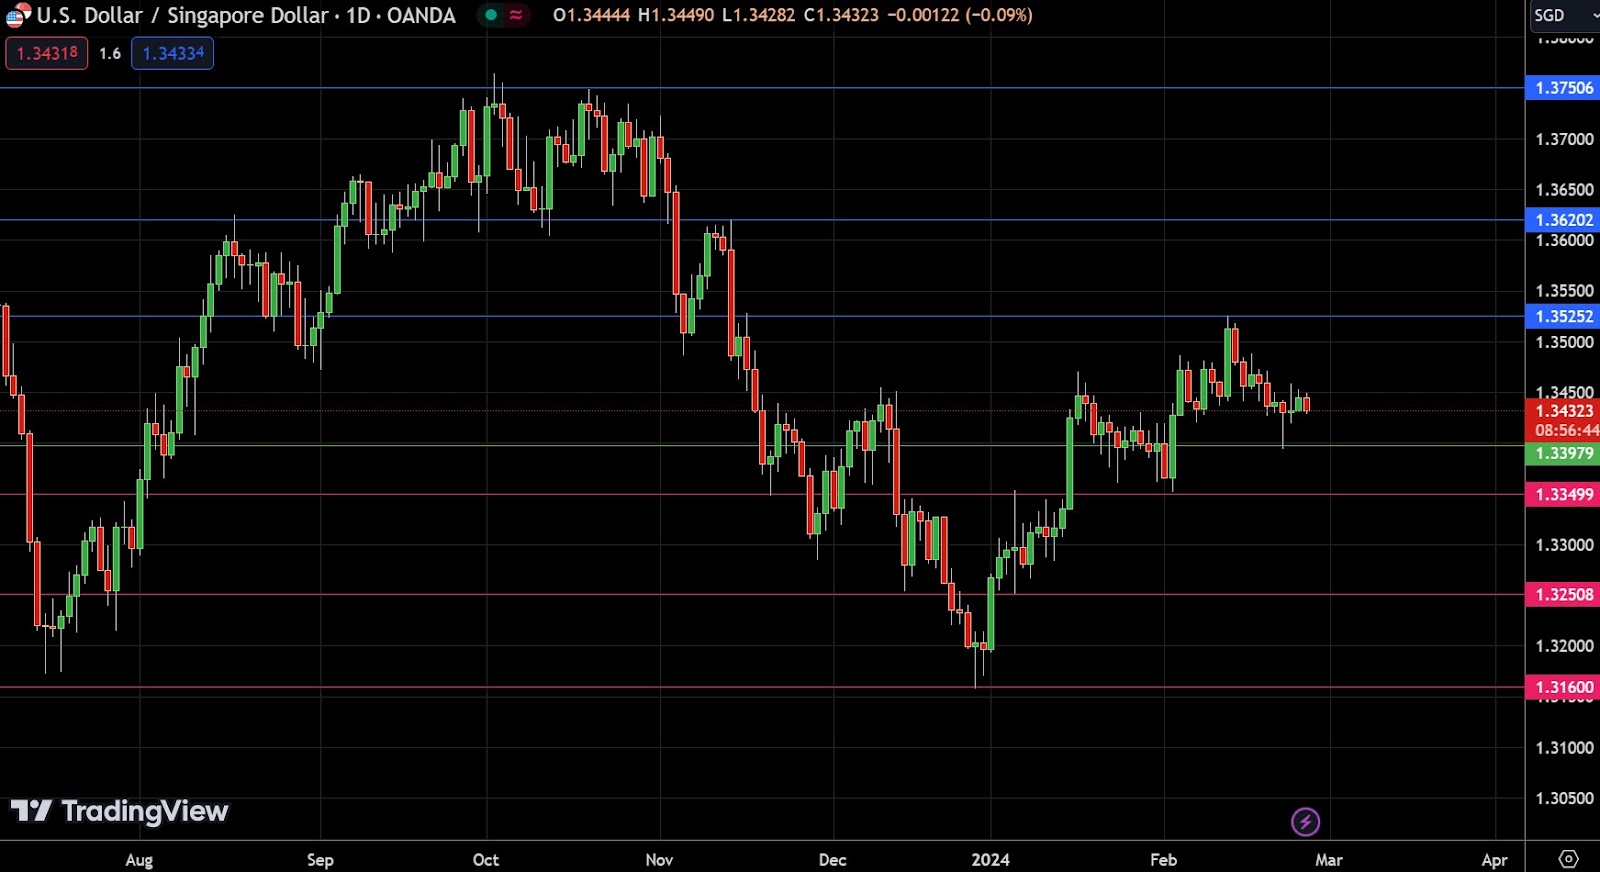
The green pivot point line, situated around 1.34323, serves as a neutral marker, signaling a balance between buyers and sellers. When prices hover above this line, it suggests bullish momentum, whereas prices below indicate bearish tendencies. Resistance levels R1, R2, and R3, positioned above the pivot, represent potential sell zones or profit-taking areas in an uptrend. On the flip side, support levels S1, S2, and S3, below the pivot, can be seen as potential buy zones or areas to place stop-loss orders in a downtrend.
- Resistance Levels : R1 (1.35500), R2 (1.36202), R3 (1.37506)
- Support Levels : S1 (1.33979), S2 (1.33499), S3 (1.32508)
These levels transcend mere numerical barriers, embodying the collective market sentiment. A breach of these thresholds signals a significant shift, a change in the wind that seasoned traders harness to navigate the markets. By engaging with these signals, one can craft a strategic playbook, complete with precise entries, exits, and risk management tactics, to sail the volatile forex seas.
Generating trading signals with moving averages in Forex
In the dynamic realm of forex trading, moving averages are instrumental for signaling potential entry and exit points. Take, for example, the EUR/USD chart displayed. Here, two moving averages—the Exponential Moving Average (EMA) 10 and EMA 50—craft a narrative of market sentiment.
The EMA 10, tracking closer to the price, reflects recent price movements, while the EMA 50 provides a smoother, longer-term trend perspective.
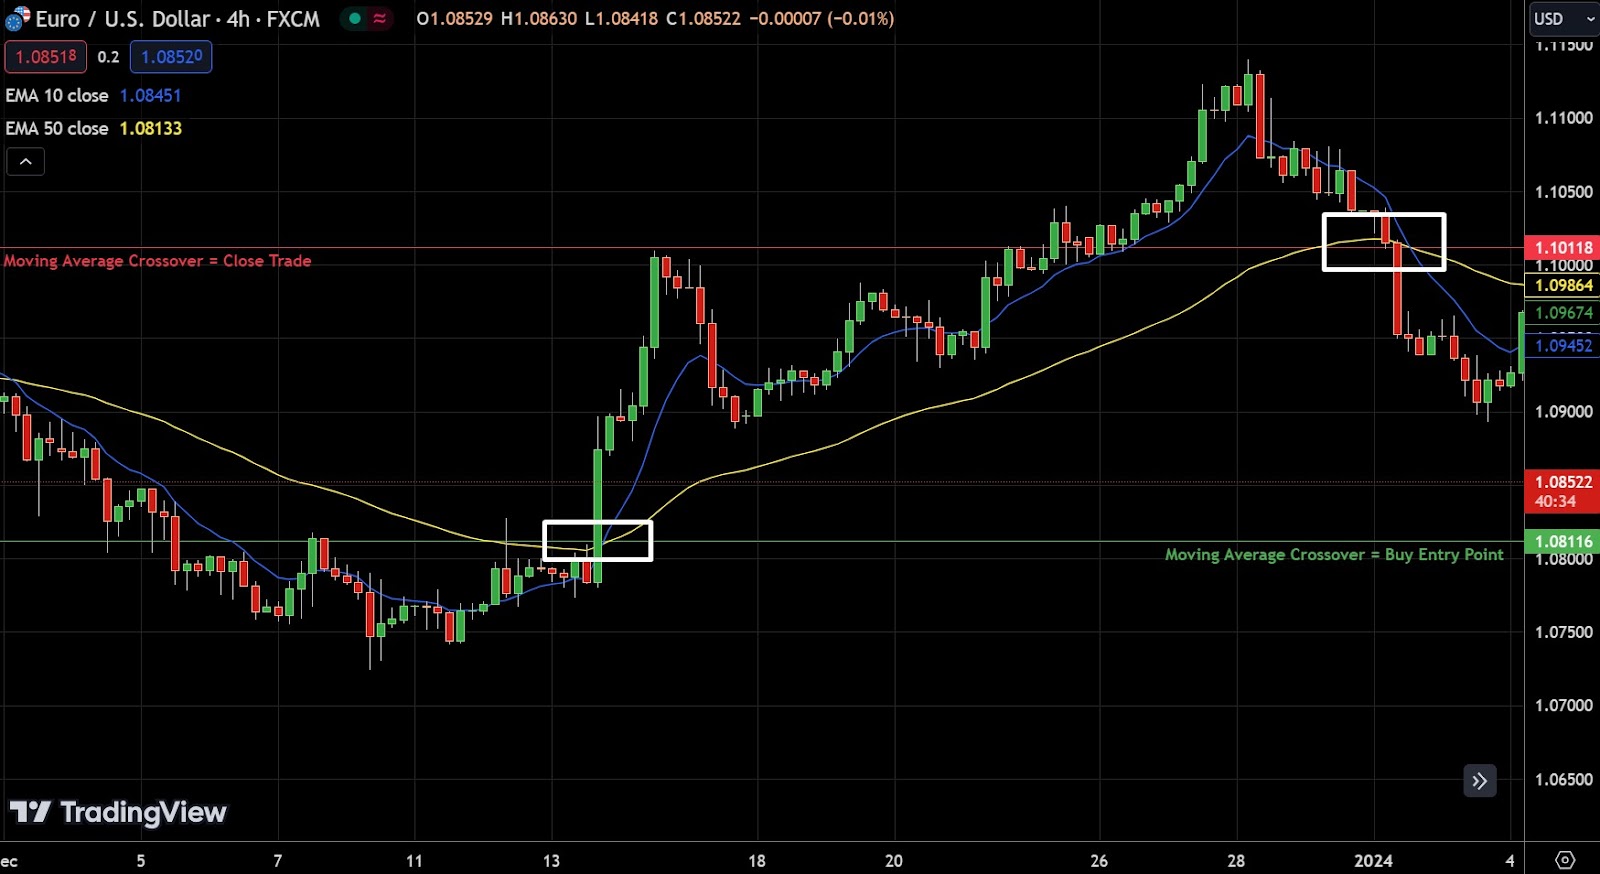
A trading signal is generated when these moving averages cross. A crossover where the EMA 10 (blue line) rises above the EMA 50 (yellow line) suggests a bullish trend, beckoning traders to consider a buy position. This is depicted on the chart at a price point around 1.09452.
Conversely, a crossover with the EMA 10 dipping below the EMA 50 indicates a potential sell signal, as seen at approximately 1.10118, advising traders it might be time to close any long positions or initiate a short.
For a newbie, these crossovers are like traffic signals on the price highway—green to go long, red to stop and potentially go short—guiding even the uninitiated through the forex market's ebbs and flows.
Relative strength index : Generating trading signal with RSI
The Relative Strength Index (RSI) is a momentum oscillator that measures the speed and change of price movements, commonly used in Forex trading to generate signals. It operates on a scale from 0 to 100 :
Interpreting RSI :
- Above 70 : Could mean a currency is overbought (too expensive).
- Below 30 : Could indicate it's oversold (potentially undervalued).
- At 50 : The midpoint, which can signal a shift in momentum.
Using RSI to Trade :
- Bullish Signal : On the chart, the RSI crosses above the 50 line, which might mean it's a good time to buy.
- Bearish Signal : If the RSI were to dip below 50, it could be a sign to sell.
For instance, the chart shows a scenario where the RSI crosses above the 50 mark (highlighted as "RSI Crossing Above 50 = Buy Trade"), suggesting that the momentum is shifting towards buying interest for the Euro against the US Dollar. In simple terms, if the RSI is rising and crosses the 50-line, it could be considered a good time to enter a buy trade, betting that the currency pair will increase in value. Similarly, if the RSI were falling below 50, it might be a signal to sell.
The RSI is just one tool among many, and while it can be helpful, it should be used in conjunction with other analyses and indicators.
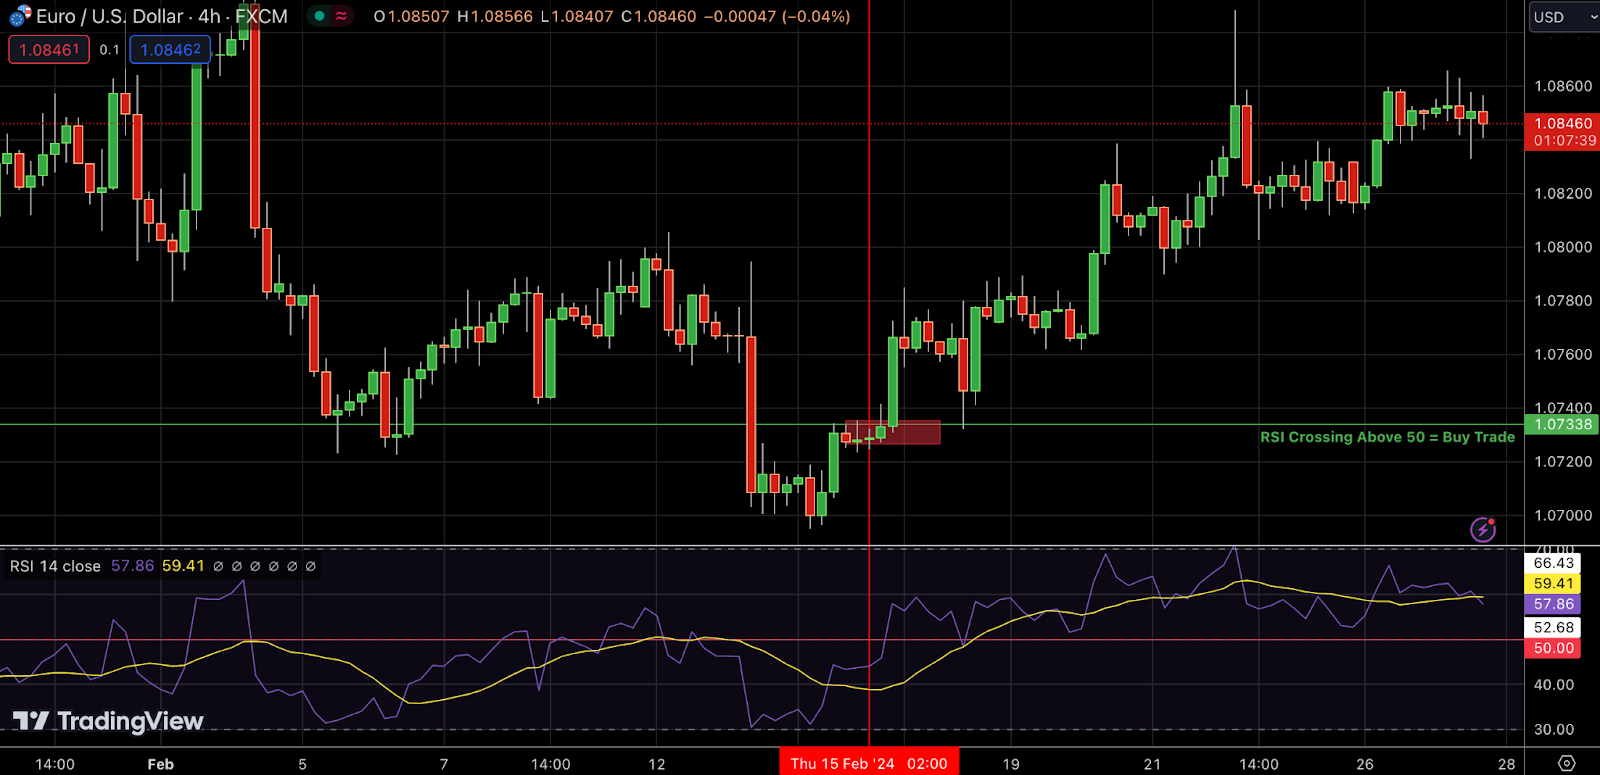
Looking at the chart provided, the RSI is marked at approximately 59.41, which is above the median line of 50. This is often interpreted as a bullish signal indicating potential buying opportunities.
Accordingly, a potential buying opportunity may arise at approximately $1,07338 as the RSI value crosses above 50. Alternatively, investors may choose to observe until the RSI re-enters bearish territory (below 50) to conclude the transaction or can simply close the trade once EUR/USD encounters a solid resistance zone. For instance, 1.08600 is currently serving as a formidable resistance area.
Decoding MACD : Simple trading signals in Forex
The Moving Average Convergence Divergence (MACD) is a crucial indicator for traders in the forex market, particularly for beginners seeking clear signals. Here’s how you can interpret the MACD using the EUR/USD chart as an example :
MACD Crossover : When the MACD line (blue) crosses above the signal line (orange), it's a bullish sign. In the chart, this crossover occurs near the 1.0738 price level, suggesting a potential upward trend and a buy signal for traders.
Signal Line as a Trigger : The signal line acts as a trigger for buy and sell signals. After the crossover, the EUR/USD price shows an uptick, validating the MACD signal.
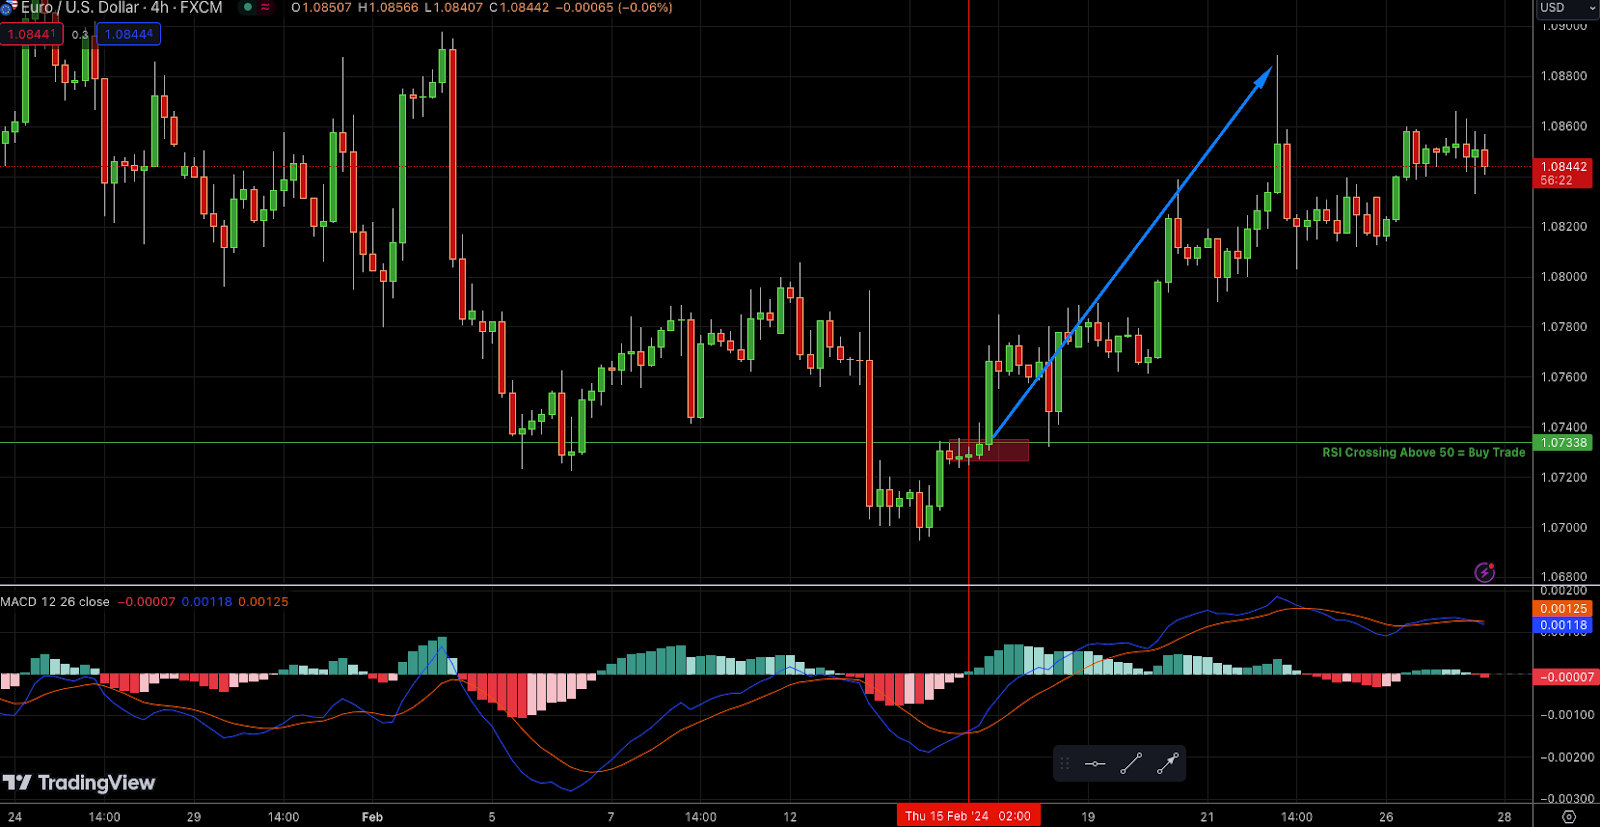
Histogram importance : The histogram bars shift from red to blue and begin to grow in height, indicating increasing bullish momentum. This transition supports the buy signal, and in our chart, this change aligns with a price increase from 1.0738 to levels above 1.0844.
Momentum Confirmation : The growing histogram and the upward trajectory of the MACD line provide confirmation of momentum, which is crucial for making informed trading decisions.
This straightforward interpretation of the MACD, supported by the price movement from 1.0738 to 1.0844, presents an illustrative scenario for forex newcomers to understand how to generate trading signals.
Trading with Fibonacci : Trading Signal on AUD/USD
Fibonacci retracement is a popular technical analysis tool used to predict future price movements in the forex market based on the premise that markets often retrace a predictable portion of a move, after which they continue to move in the original direction. It’s like the ebb and flow of the ocean—markets don’t move in a straight line but rather in rhythmic waves of retracements and continuations.
Taking the AUD/USD pair as an example, one could consider the Fibonacci levels as milestones or stepping stones, marking where the price could potentially pause or reverse. On the provided chart, the AUD/USD price finds itself in a critical juncture, with Fibonacci levels drawn from a recent low to a high point :
- The 23.6% level at 0.64963 could serve as a minor support.
- The 38.2% level at 0.64678 represents a more significant potential support zone, where the market previously found a foothold.
- The mid-point, or 50% level at 0.64448, is often watched as a psychological battleground between buyers and sellers.
- The 61.8% level at 0.6417 is known as the golden ratio, a crucial pivot area in Fibonacci studies.
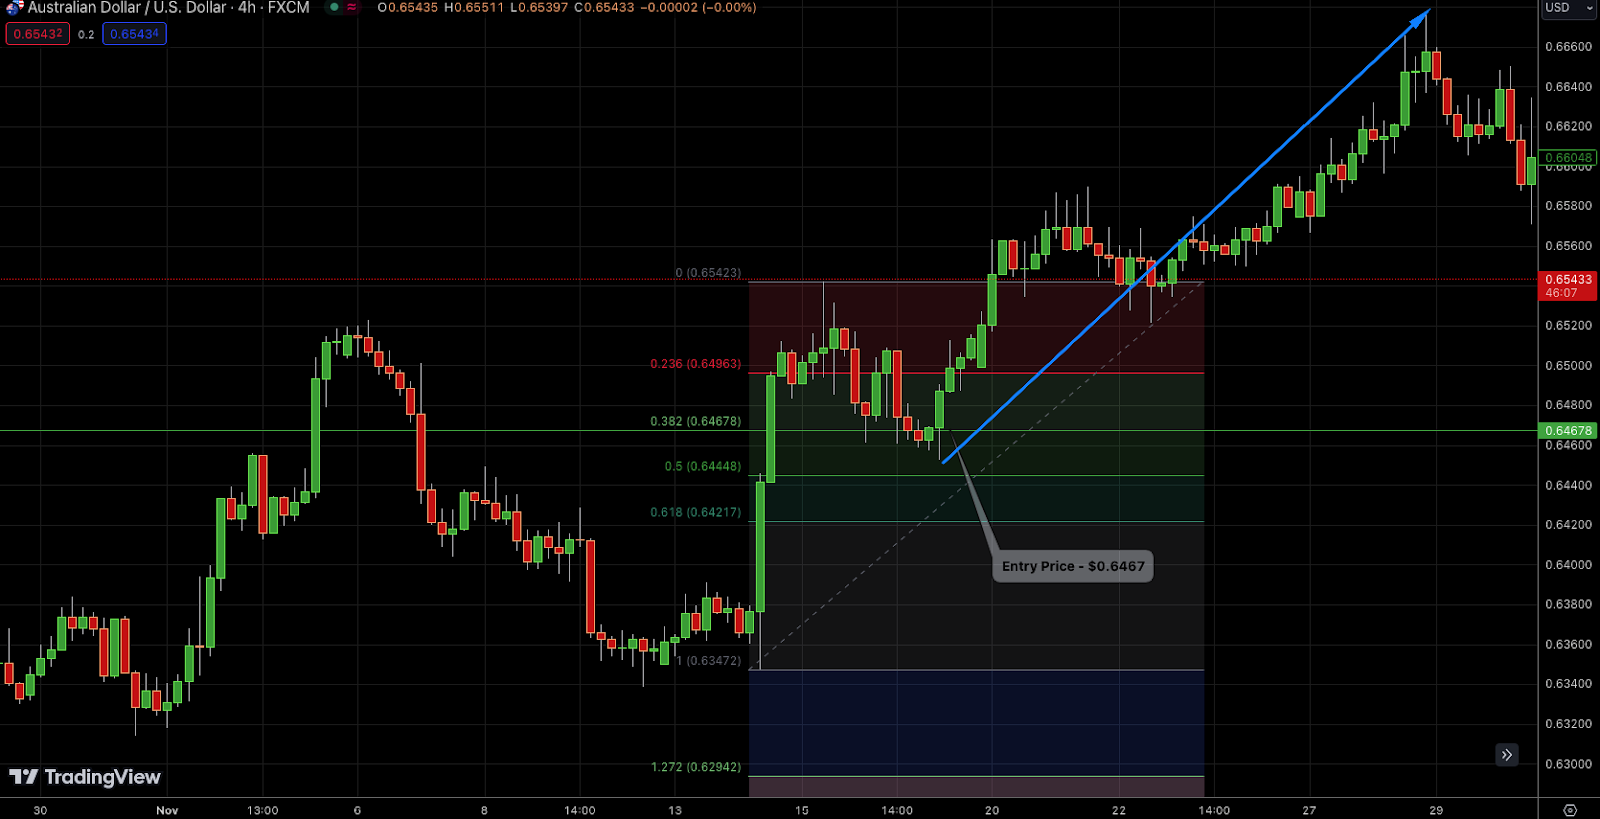
Potential Trading Signal
Based on the image provided of the AUD/USD 4-hour chart with Fibonacci retracement levels, here are the key points :
- Current Price : The chart shows the current price of AUD/USD hovering around 0.65434.
- Entry Price (BUY) : There's an indicated entry price at 0.6467.
These levels can act as signposts for traders, suggesting where to set buy or sell orders, stop losses, or take profit points. For instance, if the price bounces off the 38.2% level, traders might look to enter a buy trade, anticipating a return to the upward trend. Conversely, breaking through a level could signal further price declines, leading traders to adjust their strategies accordingly.
Automated vs Manual trading signals : Quick guide for FlowBank readers
In the realm of trading, we often encounter two distinct styles: automated and manual trading. Understanding these can be as essential as a chess player knowing when to strategically move their pawns.
Automated trading : Setting sail with strategy
Automated trading, or algorithmic trading, is akin to setting a ship's course and letting it navigate autonomously. Here, trades are executed strictly according to a pre-defined strategy. Traders must crystallize their approach to the extent that no ambiguity lingers during execution.
- Emotionless Mechanics : Imagine trading like a computer program, where emotional interference is absent. This is crucial for consistency and can be achieved using Expert Advisors (EAs) in platforms like MetaTrader.
For the layman dabbling in forex, consider the EUR/USD currency pair: If your strategy dictates a stop loss at a certain level, you hold your ground, even if market news tempts you to bail out early.
Manual trading : the art of flexibility
Contrastingly, manual trading is more of an art form, requiring a blend of solid principles and the freedom for nuanced decision-making. It's not about whimsical choices but informed decisions based on a deep comprehension of the markets and considerable experience.
- Informed flexibility : Traders may adjust their moves according to market shifts, much like a seasoned chess player adapts to their opponent's strategy.
For beginners, it's critical to differentiate between impulsive and manual trading. Impulsive trading is like a novice chess player moving pieces without foresight, often resulting in suboptimal outcomes.
In forex, a manual trader observing the AUD/USD might choose to exit a position before the pre-determined profit target is hit, based on new economic indicators suggesting a market reversal.
Final Thought :
Both trading styles serve their purpose and can be effective in the right hands. The key for traders, especially those at FlowBank, is to recognize which approach aligns with their temperament, skill level, and financial goals. Whether choosing the steadfast route of automation or the adaptable path of manual trading, the endgame remains the same: to navigate the markets with acumen and strategy.
Incorporating signals into your Forex trading strategy
Navigating the forex market requires a blend of detailed market analysis and the tactical use of trading signals. For a trader, it's about striking a balance between the hard data provided by signals and the broader market context.
Balancing signal information with other market analysis
Crafting a successful forex strategy is akin to blending various flavors in a recipe; each element should complement the other, resulting in a well-rounded dish.
- Technical indicators : Begin by considering signals from technical indicators. For example, a moving average crossover in EUR/USD may signal a buying opportunity.
- Fundamental events : Counterbalance these signals with fundamental analysis. A sudden interest rate hike can negate a bullish signal, prompting a quick strategy reassessment.
- Market sentiment : Gauge the market sentiment. If signals suggest a bullish EUR/JPY but the market is wary of geopolitical tensions in Europe, it may warrant a more cautious approach.
Practical Implementation
Integrating signals into your approach :
Applying signals to your forex trading isn't about blindly following cues; it's about integrating them into a coherent and flexible strategy.
- Signal sources : Opt for reputable signal providers. For instance, a signal suggesting a long position on AUD/USD should come from a platform with a proven track record in the Australian market.
- Risk management : Pair signals with robust risk management tactics. If a signal recommends going long on GBP/USD, set a stop-loss at a support level to mitigate potential losses.
- Continual learning : Use signals as learning tools. Analyze why a certain signal was successful or not by comparing it with market events, which can be particularly educational for beginners.
In summary, signals are invaluable in forex trading, but they should be part of a holistic strategy that includes a good understanding of market dynamics, risk management, and continual learning.
- Adaptation and Review : Regularly review the performance of the signals and be ready to adapt your strategy. If the USD/CAD pair consistently hits the resistance level indicated by signals but fails to break through, it may be time to adjust your expectations or strategy.
Avoiding common pitfalls with Forex Trading signals
Forex trading signals can be a double-edged sword. While they provide actionable data, traders can fall into traps if they're not cautious. Understanding how to sidestep common pitfalls can make the difference between a savvy trading strategy and a costly lesson.
Signal Reliability
Not all signals are created equal. The reliability of forex signals is paramount.
Vet Your Sources : Always cross-check the credibility of your signal providers. A trustworthy signal for AUD/USD would be backed by analysis and a transparent track record. Before opening each trade, make sure the signal actually makes sense and goes with your analysis as well.
Historical Performance : Prior to committing to a trading signal, it is prudent to scrutinize the historical performance of the signal provider. An exemplary track record of successful trading signals, such as a success rate of seventy-five to eighty percent, is an indicator of potential reliability.
Real-time Relevance : Ensure signals are timely. A signal for EUR/GBP that doesn't account for a just-released economic report may lead to misguided decisions.
Overreliance on Signals
Relying too heavily on signals can stunt a trader’s growth and lead to missed opportunities.
- Develop your skills : Use signals as one of many tools. Understanding the rationale behind a sell signal on USD/CHF helps develop analytical skills.
- Diversify analysis methods : Combine signals with other forms of analysis. If a buy signal for NZD/USD aligns with your technical analysis, it could confirm a good opportunity.
Confirming signal accuracy
Accuracy is critical, and confirming the precision of a signal is a step that should never be overlooked.
- Cross-verification : Compare signals from multiple sources. If two independent signals suggest a bullish trend on GBP/USD, this might increase confidence.
- Contextual confirmation : Situate the signal within its appropriate context. A buy signal for the currency pair EUR/USD should be logical if the European Central Bank (ECB) has implemented an increase in interest rates, or if economic indicators such as European Gross Domestic Product (GDP) or Consumer Price Index (CPI) have exceeded expectations, while economic events in the United States have fallen short of expectations. Under these circumstances, the Euro (EUR) is likely to appreciate in value relative to the US Dollar (USD), potentially stimulating buying activity.
- Backtesting : Historical data can be utilized to conduct backtesting of trading signals. For example, historical signals from a signal provider can be analyzed to assess their accuracy, reliability, and profitability, with particular attention paid to the risk-to-reward ratio. This analysis can assist in determining the viability of following the trading signals on a live trading account.
In essence, the prudent use of forex trading signals involves a balance of trust and verification, combining them with other analysis techniques, and constantly refining your approach based on performance and market conditions.
Conclusion :
In conclusion, the key to forex trading success lies in the strategic use of trading signals. FlowBank provides traders with an array of reliable forex signals, combining technical, fundamental, and sentiment analysis to offer a holistic view of the market. These signals are not just indicators but valuable insights that can guide both novice and experienced traders towards making informed decisions. With FlowBank, you have access to a suite of tools and expert analyses, all aimed at enhancing your trading experience.
Whether you're just starting out or looking to refine your strategies, remember to integrate signals thoughtfully into your trading routine, always considering timing, accuracy, and alignment with your goals. By partnering with FlowBank, you leverage the precision and expertise of seasoned market analysts, ensuring that each trade you make is informed and strategic.
Take the next step towards forex trading mastery with FlowBank. Explore our signals, harness our insights, and navigate the markets with confidence. Visit FlowBank's "Market News" and "Technical Analysis" sections today to access our latest trading signals and embark on a more informed trading journey. Join FlowBank and turn market signals into successful trading strategies.
