


.png?width=630&height=262&name=CFD%20Trading%20Strategies%20(1).png)
In the complex and dynamic world of CFD trading, advancing your skillset is key to capitalizing on market movements. This expert guide, brought to you by FlowBank, dives into the depths of advanced CFD trading strategies, integrating insights from both Forex and CFD realms. We explore sophisticated technical analysis techniques, including the intricate use of Fibonacci Retracement and Ichimoku Cloud, as well as delve into the nuanced world of algorithmic and high-frequency trading. Additionally, we focus on the importance of sentiment analysis, a vital yet often overlooked aspect that assesses the financial market’s mood through economic news, indicators, and social media trends.
Flowbank's guide is tailored for experienced traders aiming to refine their trading approach and gain a comprehensive understanding of the advanced strategies necessary for navigating the fast-paced CFD market. Let’s dig deeper and focus on technical analysis with the insights of fundamental analysis and the efficiency of algorithmic trading, all while emphasizing risk management, psychological resilience, and the development of a robust, adaptable trading plan.
Leveraging advanced technical analysis
In the realm of advanced technical analysis, a trader's arsenal is equipped with a variety of sophisticated tools. These include Pivot Points, Fibonacci Retracement, Moving Averages (SMA and EMA), Oscillator Trading with RSI and MACD, and the comprehensive Ichimoku Cloud. Each technique offers unique insights, allowing traders to navigate the complexities of the market with greater precision and understanding.
- Pivot Points: Utilized for determining overall market trends across various time frames, pivot points are crucial for predicting support and resistance levels based on previous market behavior.
- Fibonacci Retracement: This technique uses key Fibonacci ratios to identify potential support and resistance areas, helping traders anticipate possible reversals in the market.
- Moving Averages (SMA and EMA): Simple Moving Average (SMA) and Exponential Moving Average (EMA) are used to smooth out price action and identify the trend direction. EMA gives more weight to recent data, whereas SMA calculates an average of price data.
- Oscillator Trading (RSI and MACD): Oscillators like the Relative Strength Index (RSI) and Moving Average Convergence Divergence (MACD) are used to identify overbought and oversold conditions. RSI focuses on the speed and change of price movements, while MACD is used for understanding the momentum and possible trend reversals.
- Ichimoku Cloud (Ichimoku Kinko Hyo): This is a comprehensive tool providing insights on support and resistance, trend direction, momentum, and trade signals, useful for both quick and in-depth market analysis.
Pivot Points: A simplified Forex trading strategy
Pivot points are a key technique in trading for determining market movements and potential trends. They are calculated from the previous day's high, low, and closing prices. Trading above the pivot point is generally seen as bullish while trading below it is bearish.
Pivot Point Calculation :
- Pivot Point (PP) : (High + Low + Close) / 3
- First Level Support and Resistance :
- First Resistance (R1): (2 x PP) – Low
- First Support (S1): (2 x PP) – High
- Second Level Support and Resistance :
- Second Resistance (R2): PP + (High – Low)
- Second Support (S2): PP – (High – Low)
- Third Level Support and Resistance :
- Third Resistance (R3): High + 2(PP – Low)
- Third Support (S3): Low – 2(High – PP)
Pivot points are used to identify potential support and resistance levels and can be particularly effective with candlestick charts for visualizing price action. They help in systematic trading and decision-making, proving to be a valuable tool in a trader's arsenal for both short and long-term strategies.
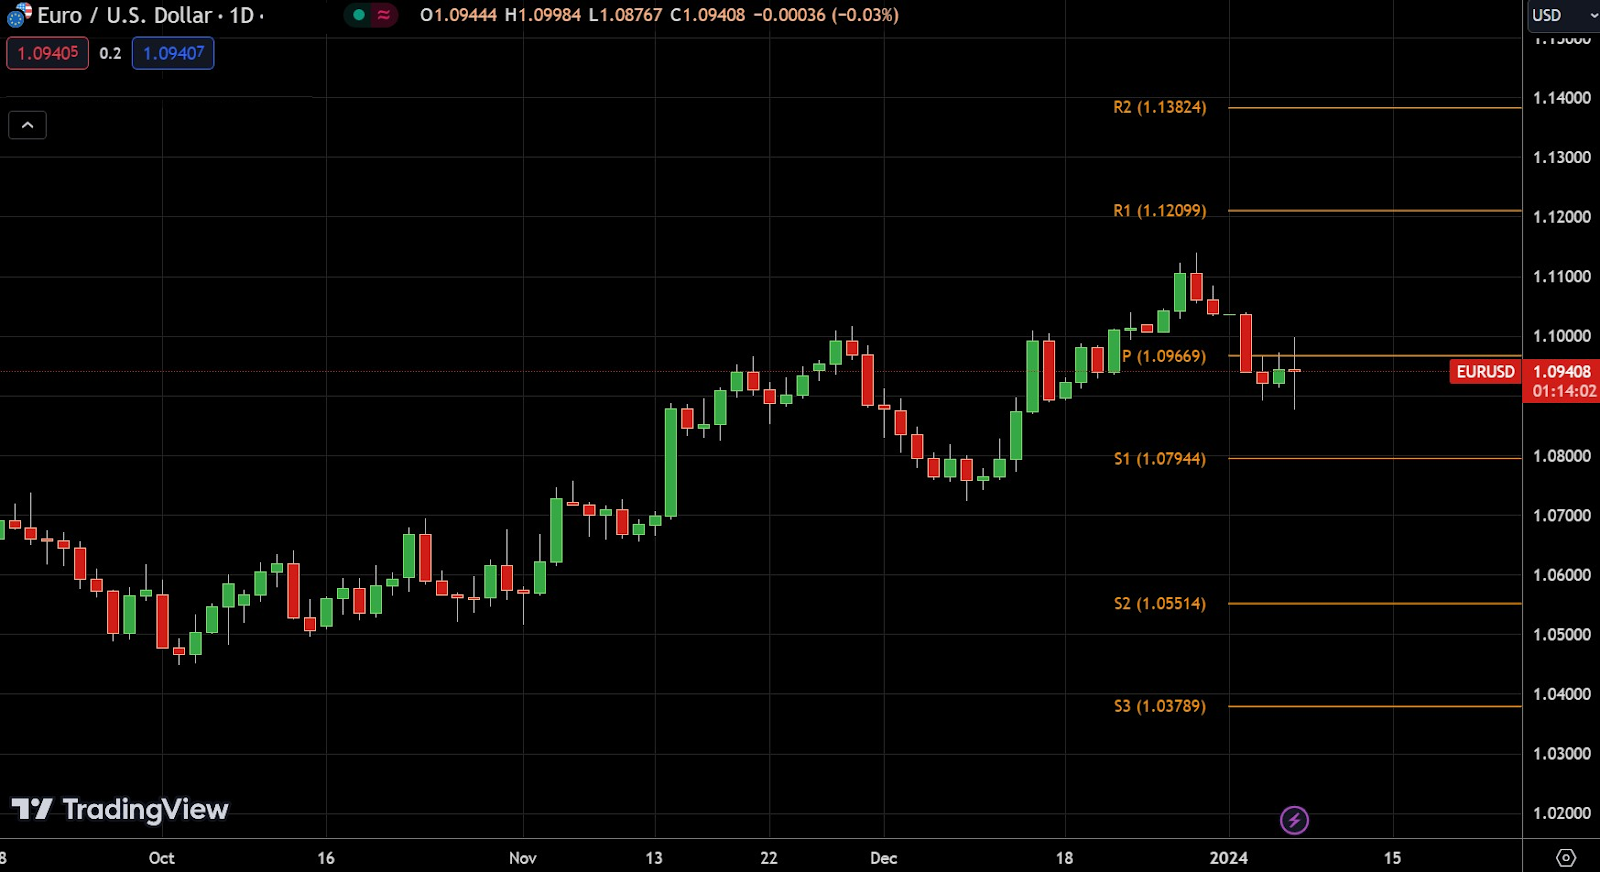
Pivot Point: EUR/USD Daily Timeframe - Source: Tradingview
Example : Looking at the chart, here's a simplified trading strategy using the pivot points shown:
- Observing the Pivot Point : Notice the line labeled 'P' at 1.09669. This is our middle ground. If the price stays above this number, traders might expect the market to go up, and if it's below, they might expect it to go down.
- Buying Strategy : If the price dips near the 'S1' line at 1.07944 but then starts to climb back up, it's like a bouncing ball — this could be a good time to buy, thinking the price will rise further.
- Selling Strategy : If the price climbs near the 'R1' line at 1.12099 but then starts to drop, it's as if it hit a ceiling and is coming back down — this could be a good moment to sell.
- Setting a Safety Net : When buying, place a 'stop-loss' just below 'S1' to automatically sell if the price unexpectedly keeps falling, minimizing losses.
- Take Profit : If the price moves favorably, you might set a goal to sell a bit below the next line up ('R1' for buys) to lock in profits.
Remember, these pivot points are like signposts — they help traders make informed decisions about where the price might go next, but there are no guarantees in trading. Always be prepared for the price to move in unexpected ways.
2. Advanced Indicators : Fibonacci Retracement
Fibonacci Retracement is a popular tool among advanced traders for identifying potential support and resistance levels. This indicator is based on the idea that markets will retrace a predictable portion of a move, after which they will continue to move in the original direction. Traders use these levels (commonly 23.6%, 38.2%, 50%, 61.8%, and 100%) to place trades at points where the market is likely to reverse.
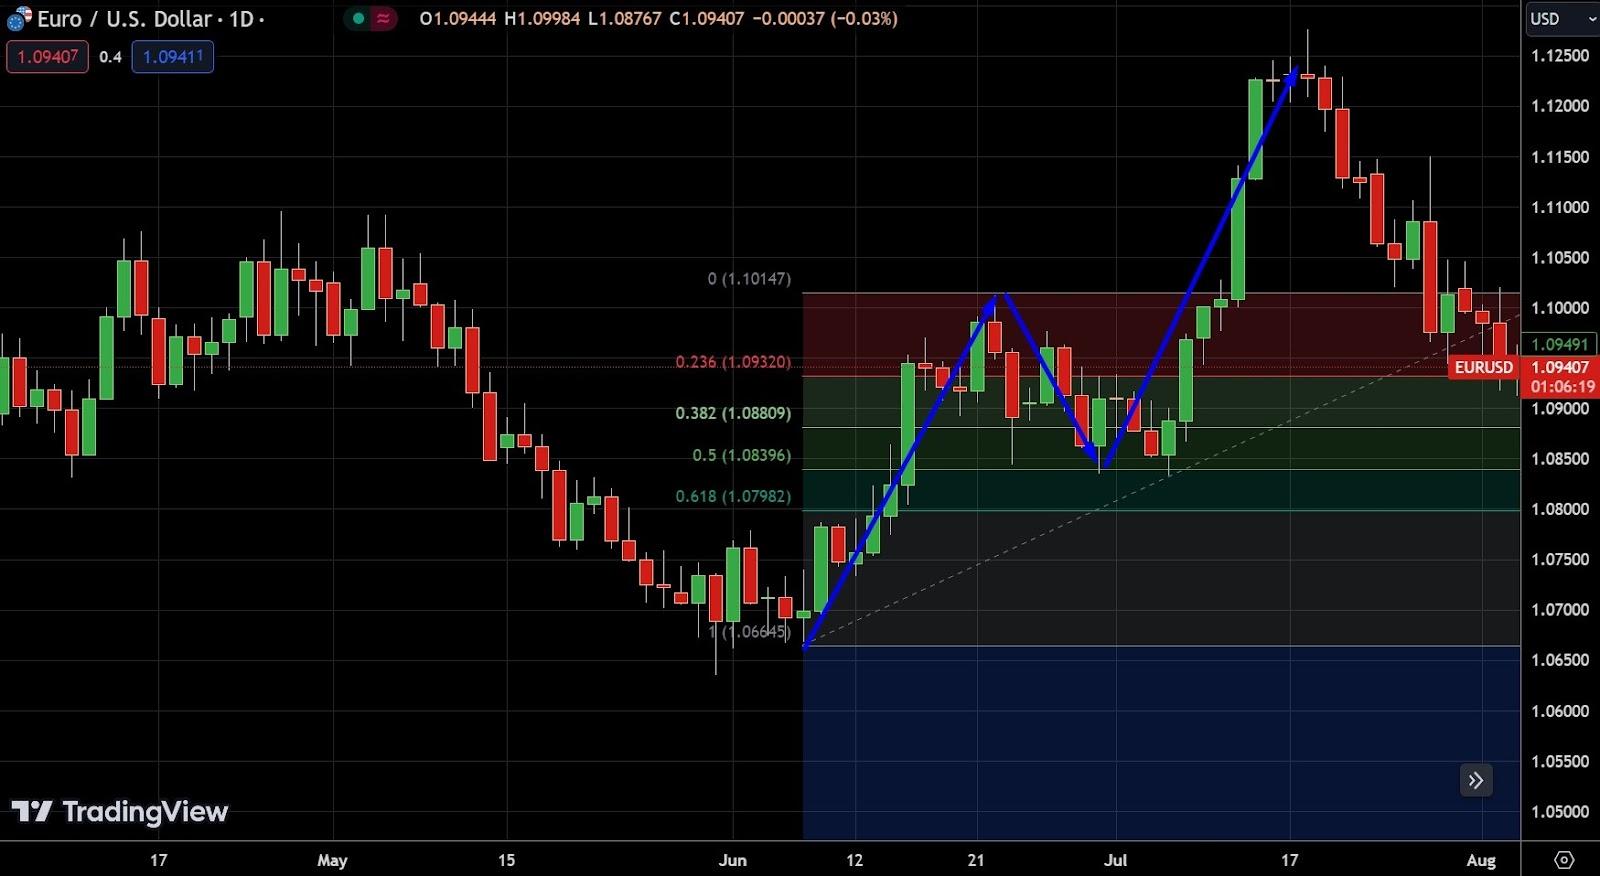
EUR/USD Daily Timeframe : Trading Fibonacci Retracement - Source: Tradingview
Example :
In the chart for the EUR/USD currency pair, we see a tool called Fibonacci Retracement applied. It's like a roadmap for where the price might pause or change direction. Here’s how you might use it :
- Identify Major Moves: Look for big climbs or drops in price. The chart shows a significant rise (marked by the blue line) followed by a decline.
- Fibonacci Levels: These are horizontal lines at 23.6%, 38.2%, 50%, 61.8%, drawn after a big price move. They predict where the price could stall or turn around.
- Trading Strategy :
- If the price drops after a rise and hits one of these lines (like near 1.08396, the 50% level), and then starts to climb again, it could be a good time to buy.
- If the price starts dropping after touching one of the lines, it might be a signal to sell.
- If the price drops after a rise and hits one of these lines (like near 1.08396, the 50% level), and then starts to climb again, it could be a good time to buy.
- Use the Figures: For example, if the price approaches 1.07982 (around the 61.8% level) and then starts rising, consider this a potential buying signal.
Remember, these are just guides – they're not always right, but they can help you decide what to do, especially if you're trying to figure out when to buy or sell.
3. Moving Averages: A Beginner's Guide by Flowbank
Moving averages help traders identify the direction of the market trend by averaging out past prices over a specific number of days or periods.
- Simple Moving Average (SMA): Gives an equal weight to each day's price over the chosen period.
- Exponential Moving Average (EMA): Puts more emphasis on recent prices, reacting more quickly to price changes.
The "number of days" in a moving average is crucial — a 50-day moving average is common for a medium-term view, while a 200-day moving average might be used for a longer-term outlook.
Shorter periods like 5 or 10 days can offer insights into short-term trends. The key is to choose a period that aligns with your trading strategy without getting caught up in market "noise" or missing significant moves.
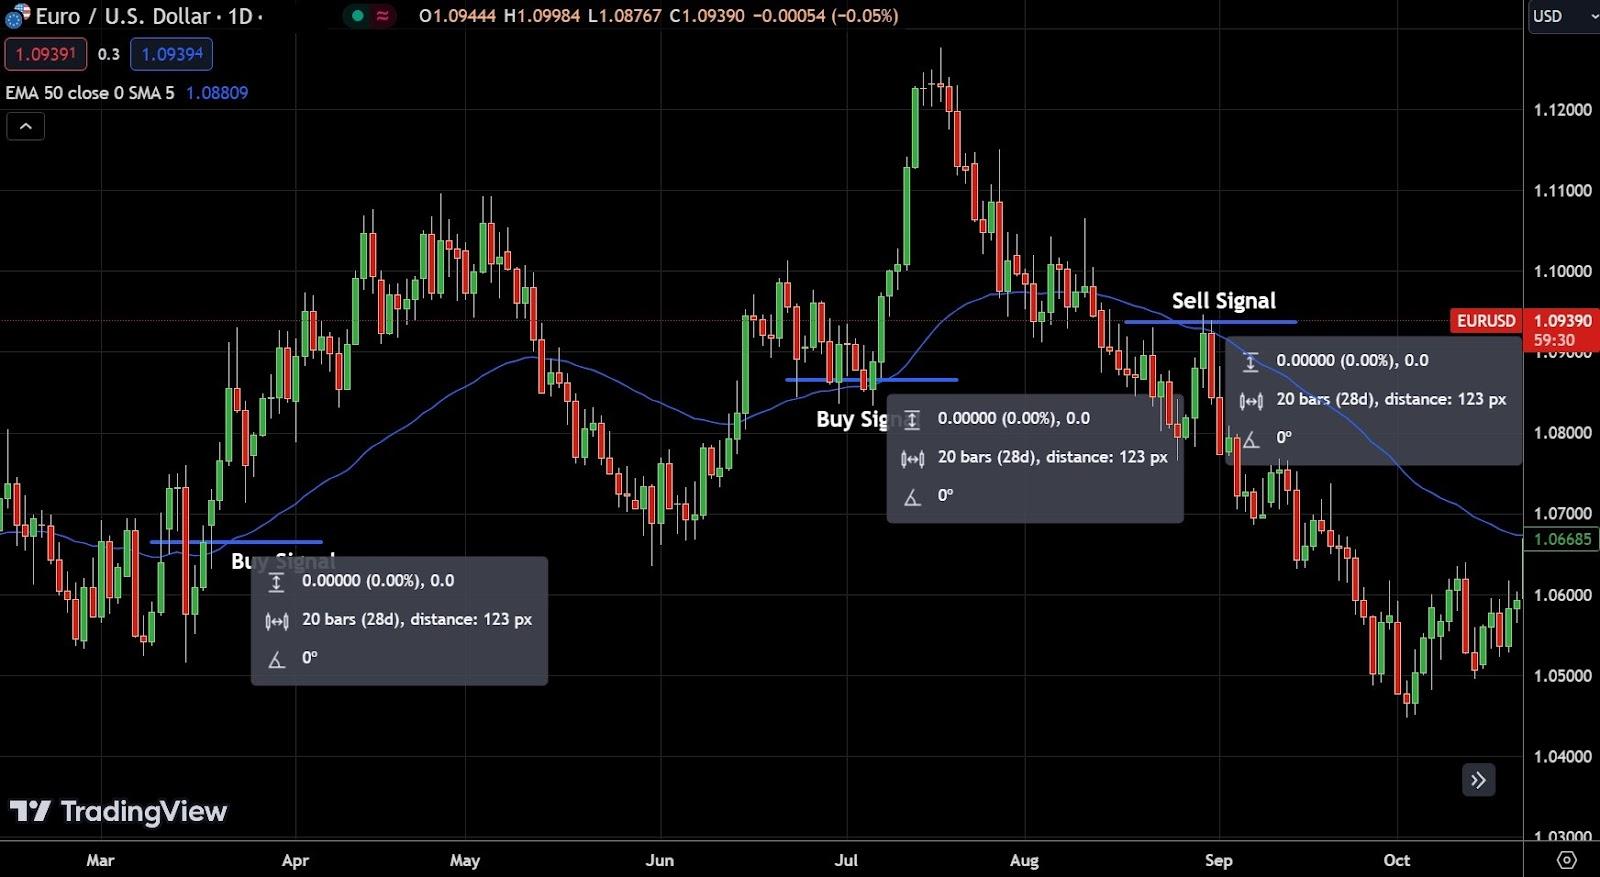
EUR/USD Daily Timeframe : Moving Average - Source: Tradingview
From the Chart :
- The blue line is the EMA, and it’s reacting more closely to the recent price drops and rises.
- The "Buy Signal" markers indicate where the price crossed above the EMA, suggesting a good time to consider buying.
- The "Sell Signal" marker shows where the price dropped below the EMA, hinting it might be a time to sell.
A Simple Trading Strategy :
- Buy : When the price climbs above the blue EMA line, like it did around the price of 1.08809, it could be a sign the market is turning up.
- Sell : Conversely, if the price falls below the blue EMA line, as it did near 1.10685, the market might be heading down.
For a beginner, just think of these lines as traffic lights: crossing above the line is a green light to buy, dropping below it is a red light that might mean stop and sell.
4. Oscillator Trading (RSI and MACD)
The Relative Strength Index (RSI) and Moving Average Convergence Divergence (MACD) are both oscillators used in technical analysis to predict potential market movements.
- RSI works by comparing the magnitude of a currency's recent gains to its recent losses, attempting to determine overbought or oversold conditions. An RSI reading over 70 typically indicates a market that may be overbought, while a reading under 30 may indicate an oversold market.
- MACD measures the relationship between two EMAs (Exponential Moving Averages). A bullish signal is generated when the MACD line crosses above the signal line, and a bearish signal is indicated when the MACD line crosses below the signal line.
Applying these indicators to the Chart :
- Buy Example : If the RSI is around 30, suggesting the EUR/USD is potentially oversold, and the MACD line crosses above the signal line at a price level of 1.08, it may be considered a buy signal.
- Sell Example : Conversely, if the RSI approaches 70, implying a potentially overbought condition, and the MACD line crosses below the signal line around a price level of 1.12, it might be interpreted as a sell signal.
These indicators can help lay the groundwork for a trading strategy, offering signals based on historical price data. However, they should be part of a broader analysis strategy and paired with risk management practices. In addition, we will delve into further details in the forthcoming educational content from Flowbank.
5. Ichimoku Cloud (Ichimoku Kinko Hyo)
The Ichimoku Cloud, or Ichimoku Kinko Hyo, is a versatile indicator that provides a wealth of information in one glance. It consists of five lines that generate signals to help traders decide on their next move :
- Senkou Span A and B
These lines form the "cloud" and help identify potential areas of support and resistance. On the chart, the cloud is represented by a light green line (1.0969) and a pink line (1.0827). The space between these lines is shaded on the chart, providing a visual representation of the market's current dynamics.
- Tenkan-sen (Turning line)
Typically the red line, it reflects the average of the highest high and the lowest low over the last 9 periods. A move above this line can indicate short-term buying interest. For example, say we’re looking at a chart and the Tenkan sen value for EUR/USD is around $1.0931, and the current market price (CMP) for EUR/USD is 1.0940, which is above the Tenkan sen line. This would indicate a buying opportunity.
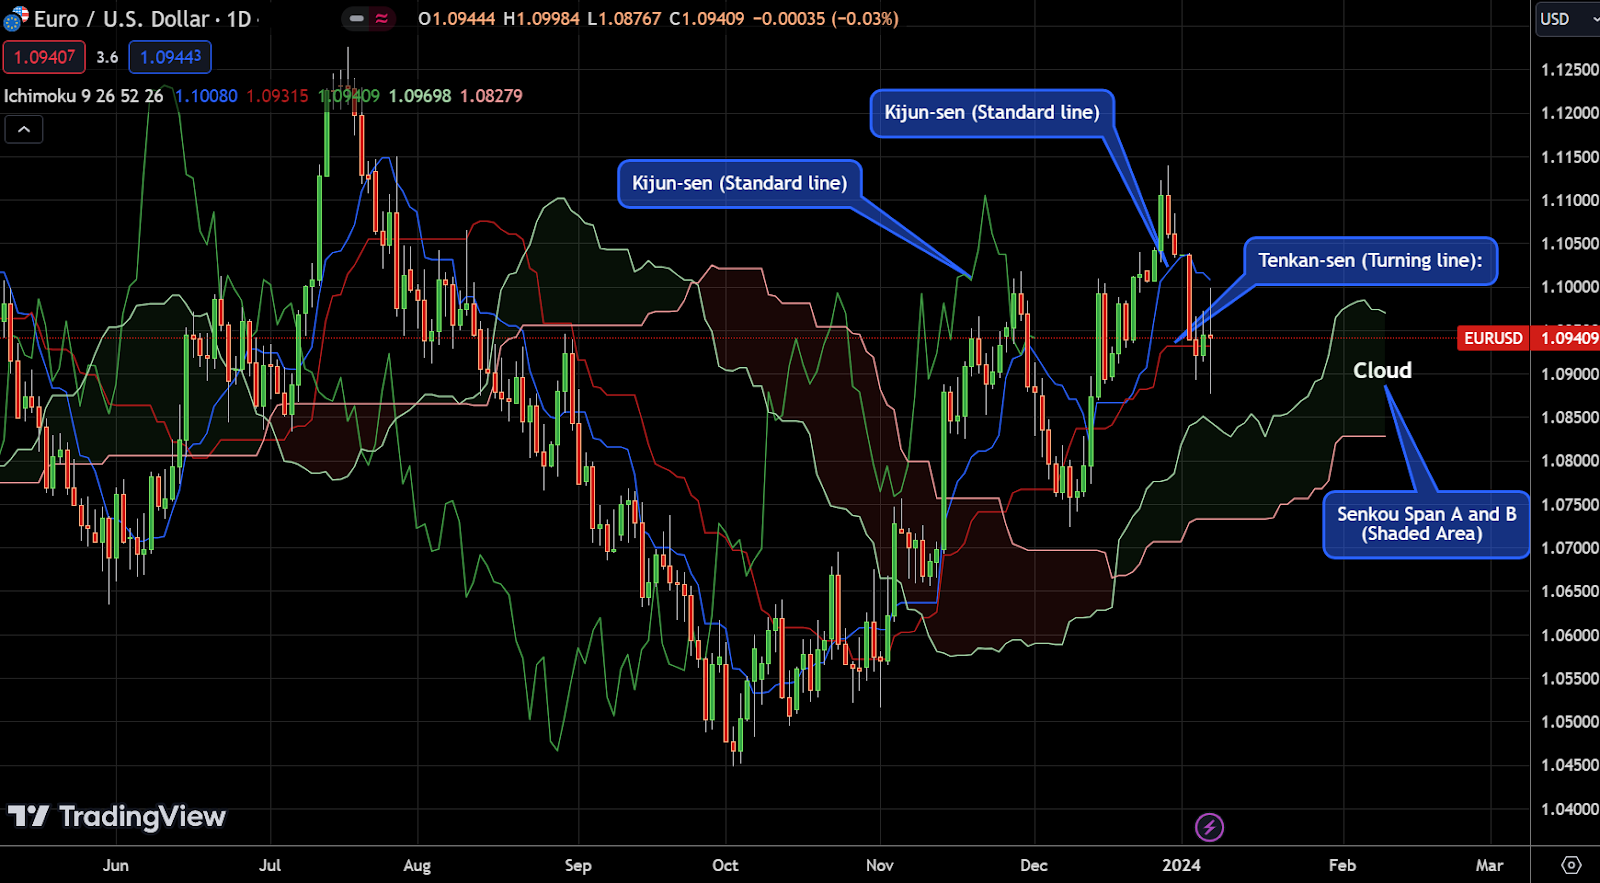
- Kijun-sen (Standard line)
This is typically the blue line, and it shows the average of the highest high and the lowest low over the last 26 periods. If the price is above this line, it may suggest a bullish medium-term trend.
In the chart above, the EUR/USD’s Kijun-sen is holding around 1.0080, but the CMP is 1.0940, which is below the Kijun-sen (Standard line). This suggests a bearish or sell signal. However, we can’t trade based on conflicts between lines, and it’s best to open a trade when all lines are signaling a sell or buy trade.
- Chikou Span (Lagging line)
The Chikou Span, or Lagging Line, is a component of the Ichimoku Cloud that is plotted 26 periods in the past on the chart. It's designed to provide context by comparing the current price momentum to the price 26 periods ago. If the Chikou Span is positioned above the price from 26 periods ago, this is typically considered to be a bullish signal. It suggests that the current momentum is stronger compared to that past period.
In the scenario where the Chikou Span is around the 1.0940 mark, and the current EUR/USD price is also around 1.0940, the interpretation would be neutral, indicating that the price momentum has not changed significantly from 26 periods ago. This could be seen as the market being in equilibrium or without a strong momentum in either direction.
Trading strategy with Ichimoku Cloud
- Bullish Signal : When the price is above the cloud and the cloud is green, it indicates a strong uptrend. Additionally, to make the trading signal more accurate, we can also wait for the price to close over all the lines we mentioned above.
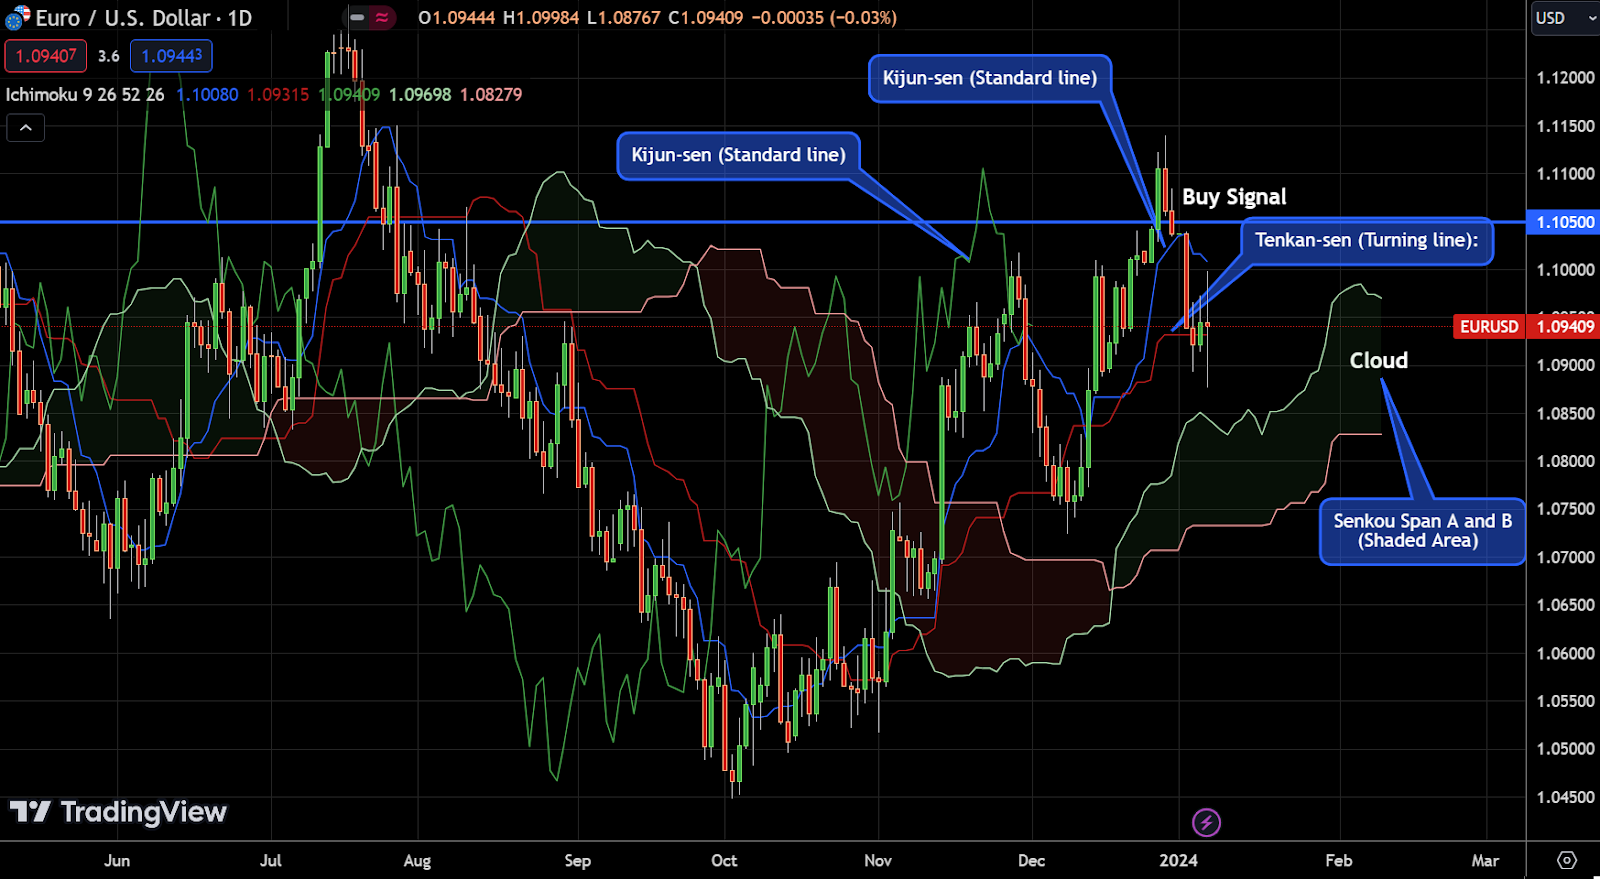
For example, entering a long position when the EUR/USD price rises above the cloud at a level like 1.10500 could be a strategy.
- Bearish Signal : Conversely, if the price is below the cloud and the cloud is red, the market may be in a downtrend. A trader might consider a short position when the EUR/USD falls below the cloud, say at a level around 1.08.
The cloud's color changes based on the relative position of Senkou Span A and B, offering a visual cue about the market sentiment. Remember, the Ichimoku Cloud provides a holistic view and should be used in conjunction with other analyses and risk management strategies.
Integrating Fundamental Analysis for Long-term Strategies
Incorporating fundamental analysis into long-term trading plans requires diligent monitoring of macroeconomic indicators, sectoral trends, and global economic shifts. Given the major role of fundamental analysis in long-term strategies and predicting the future price of Forex currency pairs, this section will focus on the major fundamentals that need to be highlighted and considered while making a decision.
Let's dive deeper.
1. Central Bank Decisions
Central banks act as the primary drivers of financial market fluctuations, particularly through the adjustment of interest rates. Their decisions impact a wide array of assets, including currencies, stocks, and commodities. For instance, changes in the federal funds rate by the Federal Reserve not only affect the value of the U.S. dollar but also have significant implications for major indices and commodities.
An unexpected increase in interest rates can strengthen the USD, influencing major currency pairs such as the EUR/USD, presenting potential opportunities for traders engaged with Flowbank.
At Flowbank, we equip traders with the ability to track and analyze central bank communications via our dedicated news blog and analytical insights. Shifts in monetary policy, asset purchasing plans, currency revaluation, or even changes in central bank personnel are meticulously analyzed, offering our clients heads up of potential market movements.
2. Economic Indicators in market analysis at Flowbank
At Flowbank, we highly value economic indicators because they are crucial for traders, who are always looking for signs that could indicate economic growth or decline. Regular economic reports provide a window through which investors can assess the financial well-being of an economy. Similar to the stock market, the foreign exchange (Forex) market is particularly responsive to even the slightest fluctuations in economic data.
In-Depth Look at Essential Economic Indicators
Understanding pivotal economic indicators, such as GDP, Inflation, Unemployment rates and Housing market statistics, is fundamental to grasping these economic undercurrents.
For instance, if the U.S. reports a lower unemployment rate than anticipated, this could result in a stronger U.S. dollar, creating beneficial trading scenarios for clients at Flowbank. Such insights are integral to informed trading strategies and decision-making.
#1: Gross Domestic Product (GDP) and Its Role in Trading can
Gross Domestic Product (GDP) is a crucial measure that reflects the total market value of all finished goods and services produced within a country over a certain period. Although GDP is recognized as a lagging indicator, astute investors pay close attention to the advance and preliminary reports released before the final GDP figures. Any large discrepancies between these reports may introduce a degree of unpredictability into the markets.
GDP is essentially a barometer of a nation's economic growth, comparable to how gross profit margin represents a company's internal growth. It is closely linked with other key economic indicators like unemployment rates and housing market trends, which collectively impact GDP outcomes.
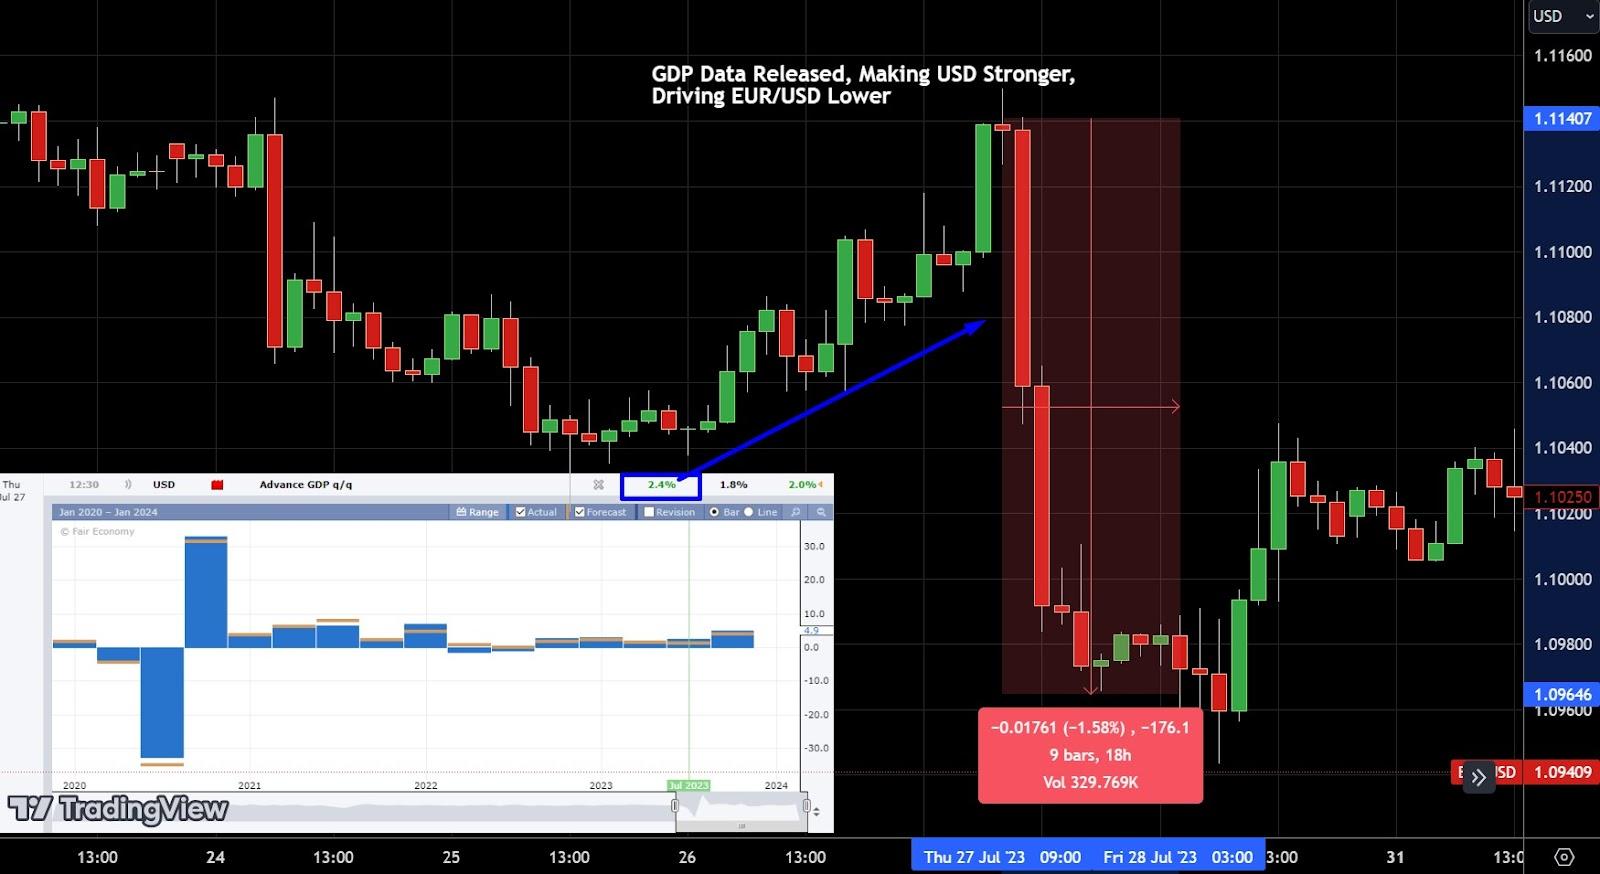
From the provided EUR/USD chart, we can observe the immediate impact of the U.S. GDP release on the currency pair. Here's how to interpret the chart :
- Before GDP Release : The chart shows EUR/USD trading relatively stable or slightly upward, suggesting market anticipation or neutrality before the data release.
- GDP Data Release : As the GDP data is released, if it indicates a stronger U.S. economy than expected, this can lead to an increase in the value of the USD. This is because a strong GDP often leads investors to anticipate potential interest rate hikes or continued economic strength, which are both positive for the currency.
- EUR/USD Reaction : A strong U.S. GDP report would typically result in the EUR/USD pair dropping, as a stronger USD means it takes fewer dollars to buy a euro. On the chart, this would be represented by a sharp downward candle following the GDP announcement, reflecting the USD's strength against the EUR.
- Figures and Change : If, for example, the GDP data released showed a 2.0% growth versus a forecasted 1.8%, this better-than-expected performance would be likely to cause a significant market reaction. On the chart, the EUR/USD might drop from a level like 1.1050 to around 1.0900, which is a 150 pips movement, indicating a strong market response.
In summary, GDP data is a powerful economic indicator that can lead to notable swings in currency pairs, with the direction of the movement depending on whether the data beats, meets, or falls short of market expectations. At Flowbank, we provide our clients with state-of-the-art trading tools, enabling them to stay well-informed and effectively manage their trades in the Forex market, thereby potentially boosting their profitability.
#2: Understanding CPI/Inflation Impact on Currency at Flowbank
The Consumer Price Index (CPI) serves as a crucial measure in financial markets, tracking the cost of over 200 diverse products. It's an essential gauge for a country's export profitability and inflation rate, both of which can significantly influence currency strength. Robust export figures usually suggest a strong currency stance.
Central banks aim to maintain inflation around a 2.0% benchmark, using CPI as the primary tool to measure and manage economic health. In contrast, the Federal Reserve in the U.S. prefers the Personal Consumption Expenditure (PCE) index as its primary inflation metric. For traders at Flowbank focusing on the U.S. dollar, the PCE index becomes an instrumental indicator for predicting future interest rate moves and, subsequently, currency valuation.
An increase in CPI can signal bullish sentiment for the related currency. For example, if the UK's CPI is projected at 2.5% while Australia's remains at 1.5%, this could indicate a stronger outlook for the British pound against the Australian dollar. Such insights into CPI differences are valuable for Flowbank traders, offering potential strategic advantages in forex trading.
#3: Key Economic Indicators for Strategic Trading
Beyond the Consumer Price Index (CPI), several other economic indicators are instrumental for traders who engage in fundamental analysis.
- Producer Price Index (PPI) : This measures the average changes in the selling prices domestic producers receive for their output. It's a leading indicator of consumer inflation and can have a significant impact on forex markets.
- Purchasing Managers' Index (PMI) : The PMI acts as a timely indicator of economic health. A reading above 50 indicates expansion in the manufacturing sector, while below 50 suggests contraction. This data is key for Flowbank traders to assess the economic vitality of a country.
- Durable Goods Report (DGR) : Representing new orders for long-lasting manufactured goods, the DGR is an important signal of manufacturing health and broader economic activity.
- Employment Cost Index (ECI) : Tracking the costs associated with employing labor, the ECI can hint at wage inflation and influence central bank policy decisions.
By keeping track of these indicators, Flowbank traders can gain a comprehensive understanding of economic conditions, which can be pivotal in formulating and adjusting forex trading strategies. Recognizing trends in these data points can lead to better anticipation of market movements and more informed trading decisions.
#4: Navigating Interest Rate and Policy Decisions in Trading with Flowbank
At Flowbank, we understand that when a nation's interest rates surpass those of another, it naturally attracts capital flows, as investors chase higher returns, often resulting in an appreciation of that nation's currency due to increased demand.
On the flip side, lower interest rates can stimulate borrowing and spending by companies, fueling economic growth.
Federal Reserve (United States) Announcements
Central banks across the globe, such as the Federal Reserve in the United States, exert a significant influence on the financial markets, especially in the currency domain through a variety of policy decisions. Here are different types of announcements made by the Fed.
- Interest Rate Decisions : The Federal Reserve's decisions on the federal funds rate act as a benchmark for U.S. interest rates, affecting the valuation of the USD. A rise in rates typically strengthens the USD, while a cut can weaken it.
- Monetary Policy Statements : These provide insights into the Fed’s views on economic conditions and monetary policy outlook, which are key for traders to anticipate future market movements.
- Quantitative Easing (QE) : The use of QE, particularly during financial crises to stimulate the economy, has a significant bearing on currency valuation. The Federal Reserve's balance sheet growth, reaching 8.24 trillion USD as of mid-2023, is a testament to the scale of such measures.
In the world of finance, the Federal Reserve may be one of the most influential institutions, but several other central banks across the globe also significantly impact the currency markets. Flowbank provides resources to keep a close eye on these institutions :
- European Central Bank (ECB) : With its hand on the pulse of the Eurozone's monetary policy, the ECB's rate decisions and statements can heavily influence the Euro and related currency pairs.
- Bank of England (BoE) : As the UK's monetary authority, the BoE's rate adjustments and policy decisions are critical drivers of the British Pound's strength and volatility.
- Bank of Japan (BoJ) : Steering Japan's economic direction, the BoJ's approach to monetary policy, including interest rates and quantitative easing efforts, can significantly affect the Japanese Yen.
- People's Bank of China (PBoC) : The PBoC's policy shifts and interventions not only affect the Chinese Yuan but also hold broader implications due to China's major economic standing globally.
- Reserve Bank of Australia (RBA) : The RBA's decisions on interest rates and its monetary policy can directly impact the Australian Dollar and its trading dynamics.
Flowbank offers insights and analysis that help traders understand and respond to these central banks' decisions, which are key to currency valuation and can provide trading opportunities in the forex market.
#5 : Labor Market Reports : Unemployment Rate & NFP
At Flowbank, we recognize that the U.S. Non-Farm Payroll (NFP) report is a significant economic measure, influencing forex market volatility. This monthly report, excluding farm and certain other workers, can dramatically sway the value of the U.S. dollar.
A rise in job numbers suggests economic strength and could boost the USD, while a fall may indicate economic slowdown and potentially weaken the USD. Flowbank offers resources for traders to navigate these shifts and adjust their forex strategies accordingly.
Algorithmic and Quantitative CFD Trading
Algorithmic and quantitative trading are revolutionizing the way individuals and institutions engage with CFD (Contracts for Difference) markets. Here’s how these advanced strategies play out :
Using Trading Algorithms
In the realm of Forex and CFD trading, algorithms act as sophisticated tools that can automatically execute trades based on specific sets of instructions. These algorithms analyze market data at lightning speeds, execute orders based on market conditions, and seek to capitalize on price discrepancies and trends.
.png?width=737&height=450&name=Graph%201%20(5).png)
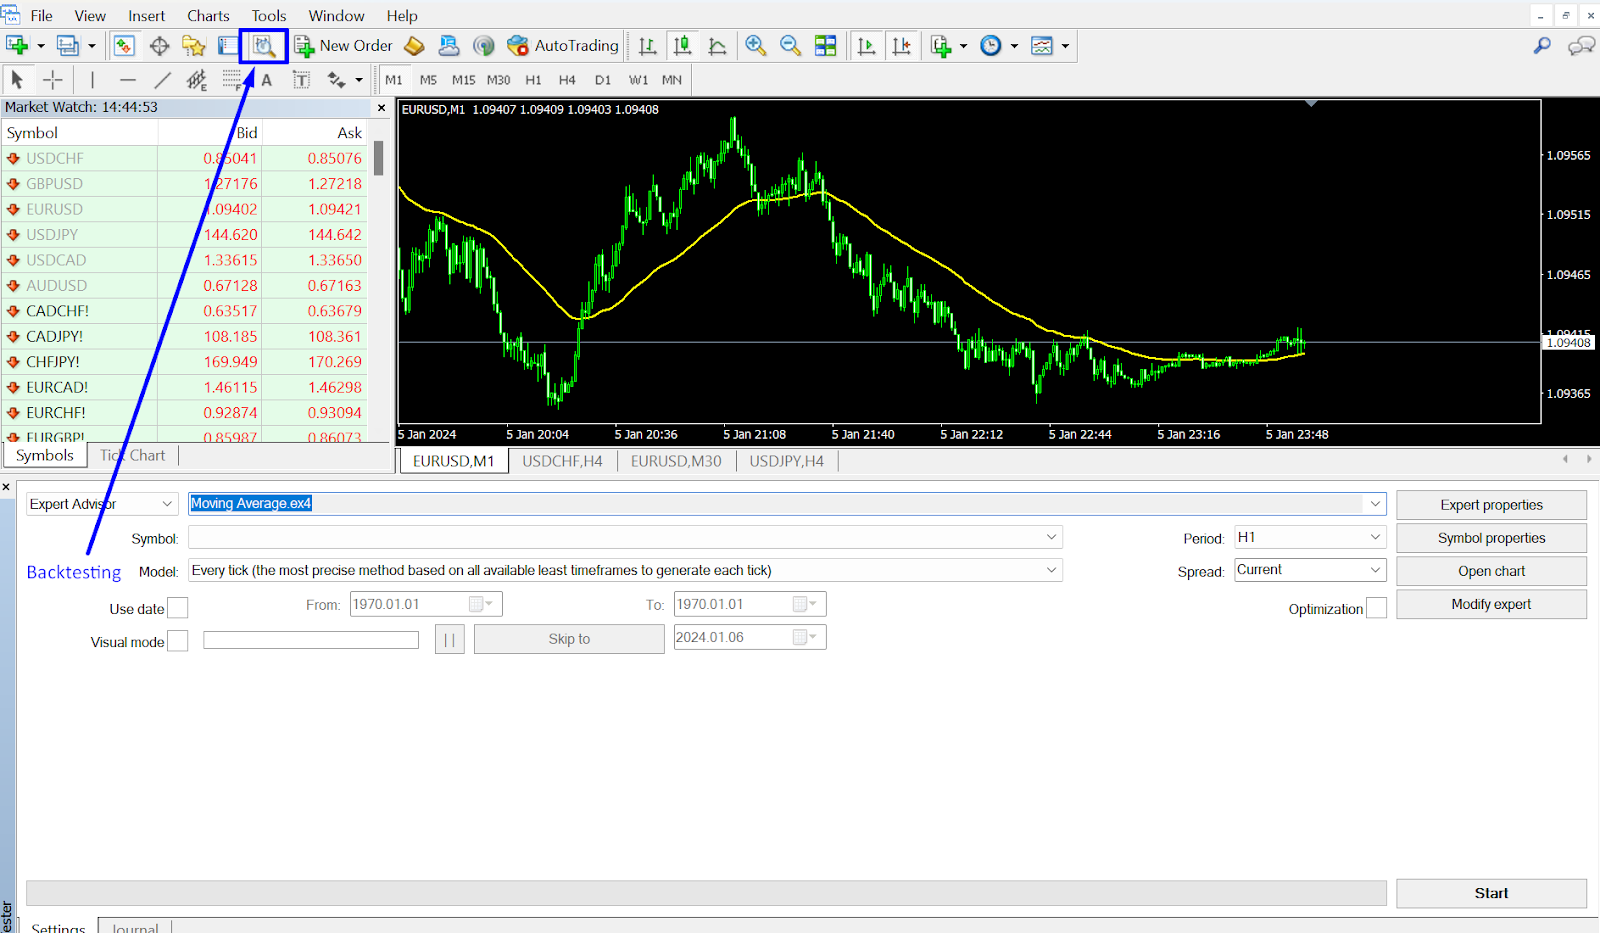
Backtesting Strategies
Backtesting is a critical step in the development of trading algorithms. It involves historical data to simulate how a trading strategy would have performed in the past. By understanding the strategy’s historical effectiveness, traders can make more informed decisions about its potential future performance.
Quantitative Analysis
Quantitative analysis forms the backbone of algorithmic trading. It uses mathematical models to understand and capitalize on market behaviors. Quantitative traders develop complex models to identify trading opportunities based on statistical and computational methodologies.
Quantitative Analysis in CFD Trading
In CFD trading, quantitative analysis involves crunching numbers from market data to forecast price movements and make informed trading decisions. Traders use this data-driven approach to identify trends, patterns, and potential entry and exit points in the markets without the influence of human emotions.
High-Frequency Trading (HFT)
High-frequency trading is a type of algorithmic trading characterized by high speeds and high turnover rates. In HFT, algorithms are programmed to move in and out of positions in seconds or milliseconds to capture quick profits from small price movements.
Risk Management
Risk management is an essential component of both algorithmic and quantitative trading. Effective strategies include setting stop-loss orders, monitoring leverage, and diversifying investments to manage and mitigate potential risks.
Algorithmic and quantitative trading strategies are now accessible to a wider range of traders, thanks to advancements in technology and data analytics. These methods offer a systematic approach to the markets, potentially reducing the impact of psychological biases and enabling more disciplined trading.
Risk Management in Advanced CFD Trading
Trading Forex and Contracts for Difference (CFDs) offers numerous advantages, such as the ability to speculate on both rising and falling markets, a wide range of tradable products, and the option to start trading with a small initial investment. However, the high risks involved can lead to significant losses if not properly managed.
In this section, we'll explore essential risk management strategies for forex and CFD trading.
Understanding Risk Management
Risk management is crucial in mitigating losses and preserving capital in trading accounts. It's a key component of successful trading, helping to ensure that profits aren't wiped out by a few bad trades. Effective risk management strategies can significantly enhance the probability of profitability in the market.
Hedging Strategies
Hedging is an advanced technique that involves taking an offsetting position to reduce potential losses on an existing trade. There are several effective hedging strategies to consider :
1. Modern Portfolio Theory (MPT) : MPT utilizes diversification to create a portfolio that minimizes volatility. It uses statistical methods to determine the optimal asset allocation for a desired return at a given risk level, factoring in the correlation between various assets.
.png?width=529&height=323&name=Graph%202%20(3).png)
2. Options Trading : Options serve as a practical tool for investors. Specifically, put options are a popular choice for those looking to hedge or safeguard an individual investment against a potential decline in value. When the price of the asset drops, the value of these put options increases.
However, there are downsides to this approach :
- Cost : Buying put options requires paying a premium, which can be a significant expense.
- Time Decay : As options near their expiration date, they often lose value – a phenomenon known as time decay.
- Limited Coverage : Using vertical put spreads can reduce the cost of premiums, but it offers limited protection. This method is suitable for single stocks, but for investors with a diverse portfolio, it's not feasible to hedge each asset individually.
For broader portfolio protection, index options are a viable alternative. These options are linked to major stock market indices like the S&P 500 and the Nasdaq. By hedging with put options on these indices, investors can mitigate risk across a wide range of stocks and sectors. One strategy to consider is the bear put spread, which, despite its cost, offers protection across numerous industries and companies.
3. Correlation Trading : Effective trading strategies should be uncorrelated, meaning they do not result in simultaneous losses. This independence in strategy performance is crucial but challenging to achieve. It helps ensure that when one strategy incurs losses, another might be profiting, thus balancing the overall portfolio performance.
4. Managing Leverage Effectively : Leverage is a double-edged sword in CFD trading. While it allows for larger position sizes than the total account value, it also increases the risk of substantial losses. For example, if you had $1,000 to invest in Tesla stock, you could buy $2,000 worth of stock with a 1:2 leverage ratio. If Tesla’s value dropped 20% in a few weeks, your investment would lose 40% because of the leverage. Therefore, it’s important to manage leverage using stop losses, calculate your margin, position size, and plan your trades in advance.
In summary, risk management in forex and CFD trading is about balancing the potential for high returns with the need to protect against significant losses. By employing strategies like hedging, understanding correlation, and managing leverage effectively, traders can navigate the complex world of CFD trading more safely and successfully.
Psychological aspects of advanced trading
Traders often experience a rollercoaster of emotions like nervousness, excitement, overconfidence, fear, and greed. The ability to manage these emotions can significantly impact the performance of a trading account. In forex trading, where market volatility is a constant factor, emotional control becomes crucial for success.
The role of emotions in Trading
Success in trading depends largely on the trader's ability to maintain discipline and manage risks, both of which are integral to trading psychology. Traders who effectively manage their emotions are more likely to make rational, informed decisions and find long-term success.
.png?width=732&height=447&name=Frame%201508%20(1).png)
Key Aspects of Trading Psychology :
- Awareness: Recognizing the influence of emotions on decision-making is essential. Traders need to be candid about their emotional state during trading sessions. For instance, feeling overconfident after a winning streak might lead to taking unnecessary risks.
- Mindfulness: Practicing mindfulness helps in staying focused and avoiding impulsive decisions based on fleeting emotions. It's about being in the moment and not letting past losses or future anxieties cloud judgment.
- Sticking to the Plan: Adherence to a well-defined trading strategy is a practical way to mitigate the impact of emotions. This involves following set guidelines for entry, exit, and risk management, irrespective of momentary emotional impulses.
- Emotional Discipline: This is about consistently managing greed and maintaining a long-term perspective. Emotional discipline is particularly important in forex trading where market fluctuations can be sudden and significant.
- Overcoming Cognitive Biases: Our brains often use biases as shortcuts to process information quickly. However, these biases can lead to skewed perceptions, affecting trading decisions. Recognizing and overcoming biases like confirmation bias (favoring information that confirms existing beliefs) and loss aversion (fearing to take necessary risks) is critical.
Take away: Continual learning and strategy adaptation
In the ever-evolving landscape of CFD trading, ongoing education and the ability to adapt strategies are critical for sustained success. At Flowbank, we emphasize the importance of continuous learning to keep pace with the dynamic nature of the markets and the latest trading methodologies.
The forex and CFD market is subject to frequent changes driven by economic events, market sentiment, and global trends. Staying informed about these changes and understanding their potential impact on trading strategies is essential.
Moreover, the complexity of the CFD market demands a multifaceted approach to trading. We advocate blending various strategies like technical analysis, fundamental analysis, and sentiment analysis to create a robust trading system. This blended strategy approach allows traders to exploit a broader range of market opportunities and manage risks more effectively.
Understanding and managing the psychological elements of trading, such as emotional discipline and cognitive biases, is crucial. Maintaining a disciplined approach, practicing mindfulness, and developing resilience against emotional reactions can significantly enhance decision-making skills in trading.
Join us on your Trading Journey :
At Flowbank, we are committed to supporting our traders through education, advanced tools, and a platform conducive to learning and growth. Embrace the journey of continual learning and strategy adaptation with us, and elevate your trading skills to navigate the CFD market effectively.
