


.png?width=630&height=262&name=In%20Depth%20Forex%20Market%20Analysis%20(1).png)
Forex trading, a dynamic and multifaceted realm, demands a deep understanding of various market analysis techniques to navigate its complexities successfully. This educational guide from Flowbank focuses on three core types of market analysis—fundamental, technical, and sentiment—each playing a crucial role in shaping trading strategies. Fundamental analysis examines macroeconomic indicators like GDP, interest rates, and employment figures, offering insights into currency strengths. Technical analysis, with tools like moving averages and MACD, dives into past price behaviors to predict future trends. Sentiment analysis captures the market's mood, influenced by news and trader perceptions.
Together, these approaches provide a holistic view of the Forex market, enabling traders to make informed decisions, understand price movements, and manage risks effectively.
Types of Forex market analysis
In the ever-evolving realm of Forex trading, a deep understanding of market analysis is essential for making informed and strategic decisions. Flowbank presents an insightful exploration into the fundamentals of Forex market analysis, tailored to both newcomers and seasoned traders.
Fundamental analysis
This approach delves into the macroeconomic factors influencing currency values. Factors such as employment rates, interest rates, international trade dynamics, GDP, and production play a pivotal role. Understanding the interplay of these elements and their impact on currency demand and supply is crucial. Fundamental analysis offers a broad view, revealing how global economic conditions steer currency trends.
Technical analysis
Here, the focus shifts to historical price movements and data patterns. Technical analysts employ tools like chart patterns, trading volumes, moving averages, stochastic oscillators, MACD (Moving Average Convergence Divergence), and the Relative Strength Index (RSI). This method hinges on the belief that past price actions can provide insights into future market behavior, offering a more data-driven perspective.
Sentiment analysis
The subjective element of trading comes into play with sentiment analysis. This approach gauges the collective mood and outlook of traders, recognizing that individual perceptions and emotions can influence market dynamics. Each trader's unique viewpoint, shaped by their experiences and interpretations of market conditions, contributes to the overall market sentiment.
Importance in trading
Integrating these analyses into your trading strategy enhances your ability to make well-rounded decisions. With a comprehensive understanding of market forces, traders can adeptly navigate the Forex market, identifying opportunities to buy undervalued currencies or sell those poised for a decline. This multifaceted approach to market analysis is key to expanding strategic thinking, mitigating risks, and capitalizing on potential gains.
Key economic indicators and their impact
Economic reports serve as a crucial tool for investors to assess a country's economic well-being. In the foreign exchange (FX) market, similar to the stock market, even slight variances from anticipated economic data can have a significant impact. These reports provide valuable insights into various economic indicators such as GDP, employment rates, interest rates and inflation, which are essential in evaluating the strength and stability of a country's economy.
#1 : Central bank decisions and market impacting
The decisions of central banks play a crucial role in shaping market dynamics, extending their influence beyond interest rate adjustments. These institutions significantly impact various asset classes, including currencies, stocks, and commodities. For example, a change in the federal funds rate by the Federal Reserve doesn't only affect the U.S. dollar; it also resonates through global stock indices like the S&P 500 and influences commodities such as gold.
Summary :
- Central Banks' Influence : Central banks shape the economy by adjusting interest rates, which affects not just currency but also stocks and commodities like gold.
- Impact on currencies : Higher interest rates usually make a currency more attractive, drawing in foreign investments and boosting its value compared to countries with lower rates.
- Broader economic effects : Interest rate changes influence overall economic health, affecting jobs, manufacturing, trade, and inflation rates.
- Opportunities for traders : For example, if the U.S. Federal Reserve raises rates unexpectedly, the dollar could rise, presenting a chance for traders to profit from movements in pairs like EUR/USD.
- Flowbank Advantage : With Flowbank, traders can stay informed and capitalize on these central bank-driven market shifts for potential gains.
Global Central Banks : Guardians of Currency Markets
The Federal Reserve may be a dominant force, but it's not alone in its influence over the currency markets. Here's a look at other key central banks and their roles :
- The European Central Bank (ECB) holds the reins of monetary policy for the Eurozone. Its decisions on interest rates and policy directives are pivotal in shaping the trajectory of the Euro (EUR) and its related trading pairs.
- The Bank of England (BoE), steward of the United Kingdom's monetary policy, has a significant sway over the British Pound (GBP). Its rate settings and policy announcements are watched closely by traders of GBP currency pairs.
- The Bank of Japan (BoJ), Japan's monetary policy architect, exerts influence over the Japanese Yen (JPY) through its interest rate decisions and quantitative easing measures.
- The People's Bank of China (PBoC) commands the monetary landscape of China. Its policy shifts and currency maneuvers are especially impactful given China's substantial stake in the global economy, affecting the Chinese Yuan (CNY) and broader market sentiments.
- The Reserve Bank of Australia (RBA) dictates the fiscal pathway for the Australian Dollar (AUD), with its interest rate and monetary policy statements influencing AUD currency pairs.
Flowbank empowers traders with quick updates and in-depth analysis of central bank announcements. Our platform offers a comprehensive news feed and expert market insights, enabling traders to stay ahead of monetary policy shifts, asset purchase programs, currency value adjustments, and key appointments within central banks.
#2 : Gross domestic product
Gross Domestic Product (GDP) is a critical economic measure representing the total market value of all goods and services produced in a country during a specific period. It acts as a comprehensive indicator of a nation's economic health. Traders often focus on the initial and preliminary GDP reports released before the final data, as differences between these reports can create market volatility.
GDP reflects a country's internal economic growth, similar to a corporation's gross profit margin. It's closely linked to other economic indicators like unemployment rates and housing market data. For instance, a rising GDP in the Eurozone could strengthen the Euro, offering traders at Flowbank opportunities to adjust their strategies accordingly.
Why Doesn't Positive Data Always Result in Sharp Buying or Negative Data in Sharp Selling ?
Contrary to what one might expect, positive economic data doesn't always lead to sharp buying, nor does negative data always lead to sharp selling. This phenomenon can be attributed to sentiment analysis, which has become increasingly influential as information is readily accessible on our smartphones. Often, expected events are priced into the market before the news release. To illustrate, let’s delve into an example.
For Example : The U.S. GDP growth announcement serves as a perfect illustration of the market adage "buy the rumor, sell the fact." When the U.S. reported a GDP growth at a 4.9% annual pace in the third quarter, surpassing expectations, the initial reaction was a spike in the Dollar Index, as traders responded to the positive news.
However, despite the positive GDP figures indicating a healthier economy, the Dollar Index, which measures the value of the U.S. dollar relative to a basket of foreign currencies, experienced a dip after the initial spike. This fall can be attributed to market participants who had already anticipated the improved GDP figures and had factored these into their trading strategies, leading to a sell-off once the news was confirmed.
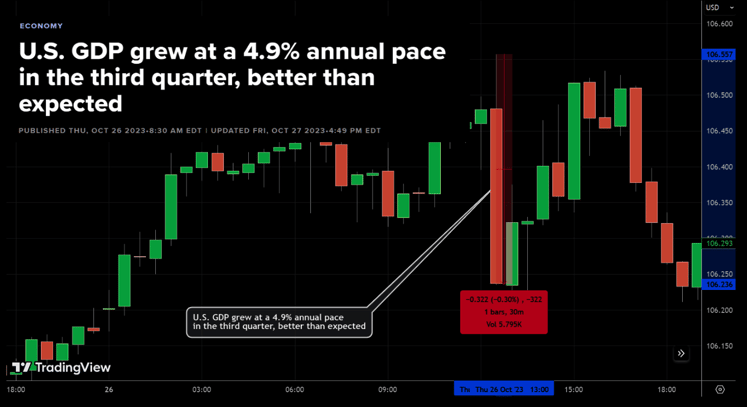
Source : Dollar Index Price Chart (Tradingview)
In the provided chart, the Dollar Index reached a peak at 106.557 after the announcement but then fell to a low of 106.236, marking a decline of about 0.30% or a 0.322 point decrease. This kind of price action is a clear example of how anticipation and reality can lead to different outcomes in the forex market, and why traders, especially those partnering with platforms like Flowbank, need to look beyond the headlines and understand the underlying market sentiments to make effective trading decisions.
#3: Labor market figures Aka unemployment rate, Jobless claims and non-farm Payrolls (NFP)
Forex traders weigh significantly on employment data to assess an economy's health. When a country reports positive employment figures—indicating a decrease in unemployment and an increase in job satisfaction—confidence in that economy typically rises. This confidence translates into greater demand for the country's currency, boosting its value. Conversely, negative employment data can signal economic weakness, characterized by low consumer spending power and higher unemployment rates, leading to a devaluation of the currency.
Understanding the impact of unemployment rate & non-farm Payrolls (NFP) on Forex
The Non-Farm Payroll (NFP) report is a critical economic indicator for the United States, reflecting the total number of paid workers across various sectors, excluding farm employees, government workers, private household employees, and non-profit organization staff. Its release can cause significant movement in the forex market due to its substantial influence on economic outlooks.
A myriad of market participants, including analysts, traders, funds, investors, and speculators, eagerly anticipate the NFP data, predicting its potential effect on currency values. Typically released on the first Friday of each month, the report outlines the monthly change in the number of paid U.S. workers in most business sectors. An increase in these figures can indicate economic expansion but may also raise inflation concerns, whereas a decrease usually suggests wider economic difficulties.
Example of employment Data's Market Impact :
For instance, consider how the Non-Farm Payroll (NFP) report impacts the Forex market. As a prime indicator of U.S. economic health, it excludes farm employees and several other job categories.
Here's a recent example to demonstrate :
- Pre-NFP Release : Gold prices were observed to be stable.
- NFP Report Announcement : Employment data revealed a substantial increase, with 216K jobs added, surpassing the anticipated 168K. Additionally, the unemployment rate showed a slight improvement, moving from 3.8% to 3.7%.
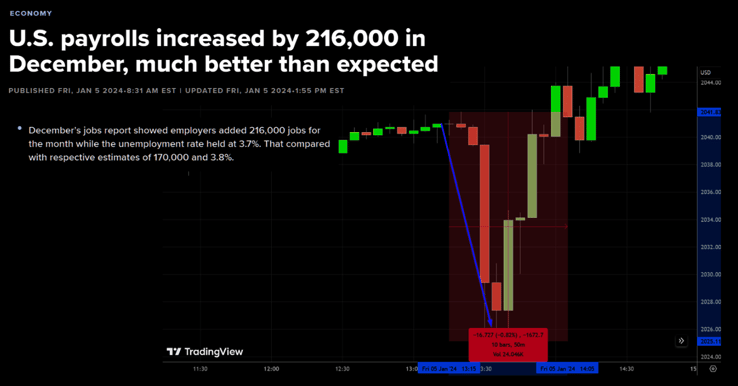
- Impact on Gold Prices : Following the release of the NFP data, gold prices experienced a noticeable decline. Specifically, there was a drop of about 0.82%, or approximately $16 per ounce, pushing gold prices down from $2,041 to $2,025.
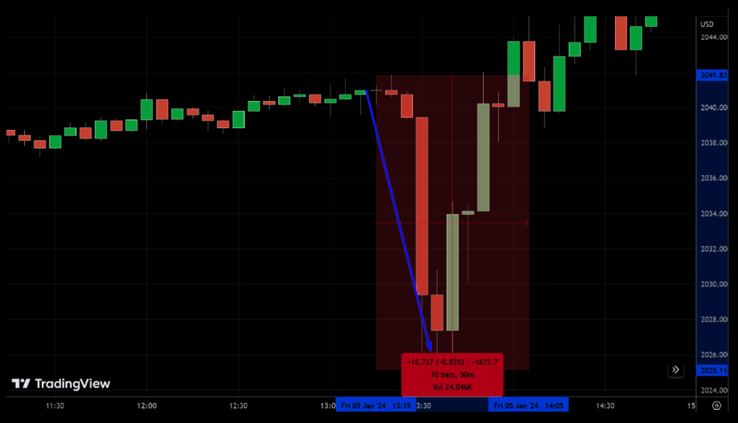
Why the Reaction ?
The positive job data implies a robust U.S. job market, typically fostering bullish sentiment for the U.S. dollar. As the dollar strengthens, gold prices—often inversely correlated to the currency—tend to fall, as seen after the announcement of the NFP report.
#4 : Understanding inflation through the Consumer Price Index (CPI)
The Consumer Price Index (CPI) is a barometer of inflation, reflecting the average price of over 200 goods and services. It's also a window into a country's export health. Strong export numbers can signal a robust currency, prompting traders to adopt a bullish outlook. The US central banks, Federal Reserve, typically target a 2% inflation rate, using the CPI as a guide. However, the U.S. Federal Reserve opts for the Personal Consumption Expenditure (PCE) index. An ascending CPI can spell good news for a currency.
For example, if the UK's CPI is projected at 2.5% and Australia's remains at 1.5%, this could signal a strengthening of the GBP against the AUD. Such insights are crucial for traders seeking to navigate currency markets effectively.
#5 : Broadening the economic view with additional indicators
Beyond the CPI, traders have a suite of indicators at their disposal to assess economic health, particularly useful for those utilizing Flowbank's comprehensive trading resources :
- Producer Price Index (PPI) : This index measures price changes from the perspective of the seller and is a key indicator of inflation at the production level, influencing forex market dynamics.
- Purchasing Managers' Index (PMI) : As a timely indicator of economic activity, a PMI over 50 suggests expansion, while below 50 suggests contraction. Flowbank traders can leverage PMI data for insights into a country's economic performance.
- Durable Goods Report (DGR) : Reflecting new orders for hard goods, the DGR offers a glimpse into manufacturing health, which in turn affects the wider economy.
- Employment Cost Index (ECI) : Monitoring labor cost changes, the ECI sheds light on inflationary pressures and potential central bank policy changes.
By synthesizing information from these indicators, Flowbank traders can gain a comprehensive understanding of economic trends, aligning their strategies with the current economic narrative to optimize their forex trading endeavors.
Technical Analysis : Best Tools & Techniques in Forex Trading
At Flowbank, we emphasize the power of technical analysis as a beacon for forex trading. This method scrutinizes past price actions and market data to forecast future currency movements, offering a strategic edge. Technical analysis operates on the premise that price trends and patterns repeat over time, providing a predictive value. This approach, distinct from fundamental analysis, eschews economic reports and focuses on chart patterns and price history to inform trade decisions.
Whether you're a seasoned trader or just starting, our platform equips you with the technical insights to navigate the forex market confidently. In this section, we will explore top technical analysis tools and techniques employed in the foreign exchange (forex) trading arena.
# 1: Average Directional Index (ADX)
The ADX is a tool traders use to measure the strength of a trend. It doesn't show the trend's direction but how strong the current trend is. Here's a simple way to understand ADX readings :- ADX below 20 : The trend is weak, usually with no clear direction.
- ADX between 20 and 40 : Indicates a strong trend, where the market is moving with conviction.
- ADX above 40 : Suggests an extremely strong trend, signaling a powerful market move.
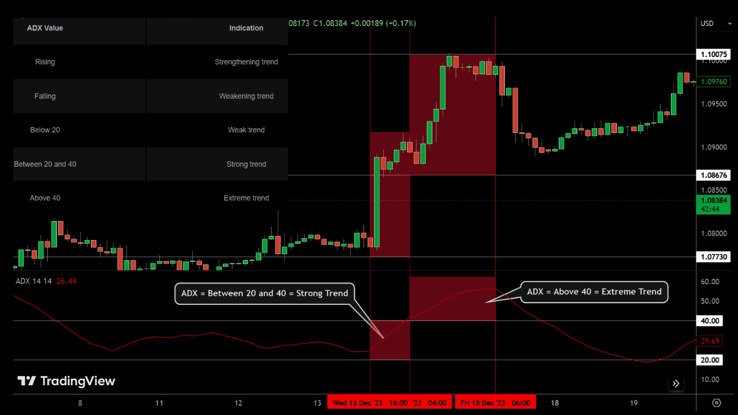
For instance, on a forex chart, if you see the EUR/USD pair rising and the ADX is above 40, it implies there's strong momentum in the market, though it doesn't tell us if it's up or down. The specific ADX value and the corresponding EUR/USD price level provide insights into the market's vigor at that moment.
# 2: The On-Balance-Volume indicator (OBV)
The On-Balance Volume (OBV) is a unique momentum indicator, tracking the flow of trading volume in and out of a currency pair like a financial heartbeat.
- What is OBV ? It's a line on the chart that rises with buying pressure and falls with selling pressure, much like a gauge measuring the intensity of market interest.
- Origin : Joseph Granville introduced OBV in 1963, suggesting that volume precedes price movement, offering clues about future market direction.
- How OBV Works : If OBV climbs but prices don't, think of it as a coiled spring. This tension often hints at an upcoming price surge in the direction of the volume change.
For instance, in the EUR/USD chart :
- If OBV starts inching up while the price of EUR/USD stays the same, it hints at a potential upward price breakout.
- This pattern suggests traders are accumulating positions, and a price movement might soon follow the OBV's lead.
In essence, OBV acts as a market mood ring, hinting at what traders might do next, based on how they've been trading, not just what the price is doing. It's like watching the crowd at a sports event; if they start getting excited, you expect something big is about to happen on the field.
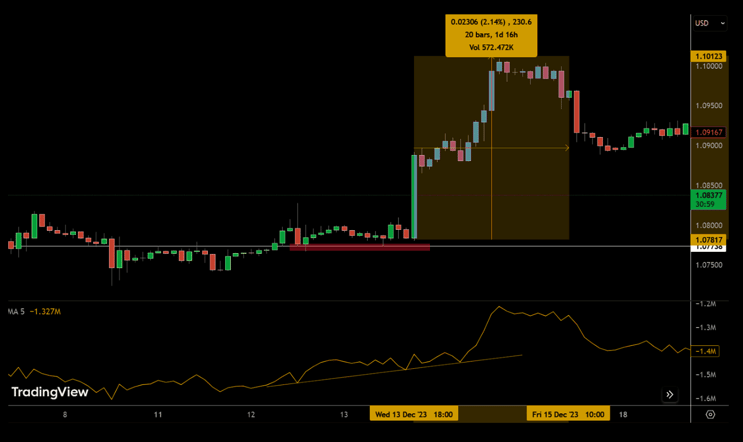
For Example : In the provided EUR/USD chart, we see a highlighted period where the currency pair experienced a notable rise. Over the course of approximately 20 bars, which translates to a day and 16 hours, the price of EUR/USD ascended from around 1.08717 to a peak of 1.10123. This represents an increase of approximately 2.14%, equivalent to a change of about 230 pips (a pip is the smallest price move that a given exchange rate can make based on market convention).
During this same period, the On-Balance Volume (OBV), which is an indicator used to measure buying and selling pressure, also showed an increase. An ascending OBV line indicates that buyers are willing to step in and purchase at higher prices, confirming the momentum behind the price increase.
# 3: The Relative Strength Index (RSI)
The Relative Strength Index (RSI) is a popular tool used by traders to gauge the momentum and potential price reversal points of a security. It helps to identify overbought or oversold conditions in the trading of an asset.
- Purpose of RSI : RSI measures the velocity and magnitude of directional price movements. Essentially, it's like a speedometer for a stock's or currency pair's recent performance, indicating if it's moving too fast and might need to slow down (overbought) or if it's lagged behind and might pick up (oversold).
- Creator : Developed by J. Welles Wilder Jr., RSI was introduced to the world through his 1978 book, which laid the foundation for modern technical analysis.
- RSI Calculation : It involves comparing the average gains versus the average losses over a specific period. The RSI value moves between 0 to 100, with levels marked at 30 and 70 typically indicating oversold and overbought conditions, respectively.
- Usage : Placed below a price chart, the RSI oscillates to reflect the balance between bullish and bearish pressures. It's like watching a tug of war between buyers and sellers, with the RSI line showing which side is winning and by how much.
- Interpretation : Signals from RSI can be powerful when they align with the overall trend. But beware of false signals—just like a storm warning that turns into a sunny day, the market can surprise you with a sharp move opposite to the RSI indication.
For instance, if RSI crosses above the 70 level, it suggests the asset may be overbought and due for a pullback. Conversely, an RSI below 30 could indicate an oversold condition and a potential price bounce.
.png?width=738&height=410&name=Graph%205%201%20(1).png)
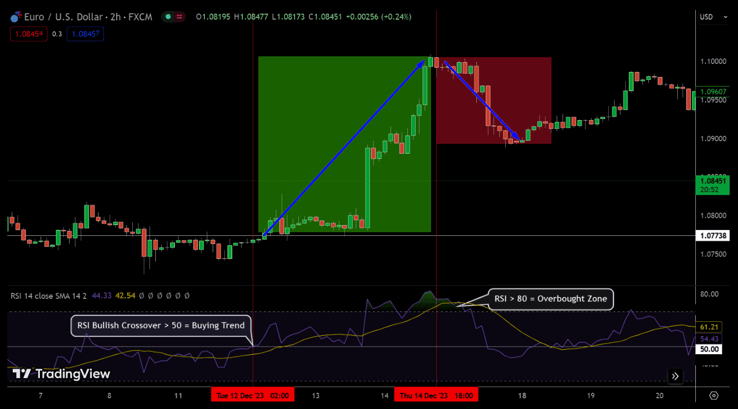
For Example : The EUR/USD chart shows that after the RSI crossed above 50, the EUR/USD price increased sharply by over 2%, indicating a bullish trend. This is reflected by a green area on the chart, which shows the price rise. Similarly, once the Relative Strength Index (RSI) surpasses the overbought threshold of 70, the bullish momentum begins to wane, initiating a bearish correction.
# 4: Moving Average Convergence Divergence (MACD)
The Moving Average Convergence Divergence (MACD) is a trend-following momentum indicator that shows the relationship between two moving averages of a security’s price.
- How MACD is Formed : It's constructed by subtracting the 26-period Exponential Moving Average (EMA) from the 12-period EMA. The result of this subtraction is the MACD line.
- Signal Line : A second line, called the signal line, which is the 9-period EMA of the MACD line, is then plotted on top of the MACD line, which can function as a trigger for buy and sell signals.
- Optimal Time Frame : MACD is typically used on daily charts with the standard settings of 26, 12, and 9 days, although these can be adjusted to suit different trading strategies and time frames.
- Understanding MACD : Traders watch for when the MACD crosses above (to buy) or below (to sell) the signal line. The MACD is also useful for understanding potential price direction and momentum.
- Limitations : A common pitfall of the MACD is false positives; it might indicate a price reversal that does not materialize, potentially leading to misleading trade signals. It also doesn't catch every price reversal, meaning it might miss some significant market moves.
For instance, if the MACD line intersects above the signal line, traders at Flowbank may regard it as a bullish indication around $1.0777, implying growing momentum and potentially an opportune moment to initiate a long position. Until such time as the MACD has formed an initial red histogram below zero, the EUR/USD has retained its bullish trajectory. However, with the histogram falling below zero, the currency pair has transitioned into a bearish phase, presenting a selling opportunity.
# 5: Moving Average (MA)
A moving average smooths out price data by creating a single flowing line, making it easier to identify the direction of the trend. It's a key indicator used in technical analysis that averages an asset's price over a certain period, like smoothing the sea for clearer navigation.
- Role in trading : Moving averages help traders spot trends, momentum, and potential reversal points in the market. They can signal when it's time to buy or sell by showing if an asset's price is above or below the average.
- Calculation Basics : A moving average is simply the sum of a certain number of previous prices divided by that number. For example, a 20-day moving average adds up the closing prices of the last 20 days and divides by 20.
Types of Moving Averages :
- Simple Moving Average (SMA) : This average takes the arithmetic mean of a set of prices over a number of days. Each price point is equally weighted, making it straightforward but potentially slower to react to recent price changes.
- Exponential Moving Average (EMA) : The EMA gives more importance to recent prices, making it more responsive to new information – ideal for traders looking for quick market entry and exit points.
- Weighted Moving Average (WMA) : This average assigns more importance to recent data points, but unlike the EMA, the increase in weight is not exponential. It's a balance between the immediacy of the EMA and the stability of the SMA.
Choosing the Right Average : Your trading strategy should guide which moving average you use. Longer-term traders might prefer the SMA for its stability, while day traders might choose the EMA for its quick response to price changes. The WMA can be a good middle ground, offering a weighted look at recent price action without the rapid shifts of the EMA.
For example :
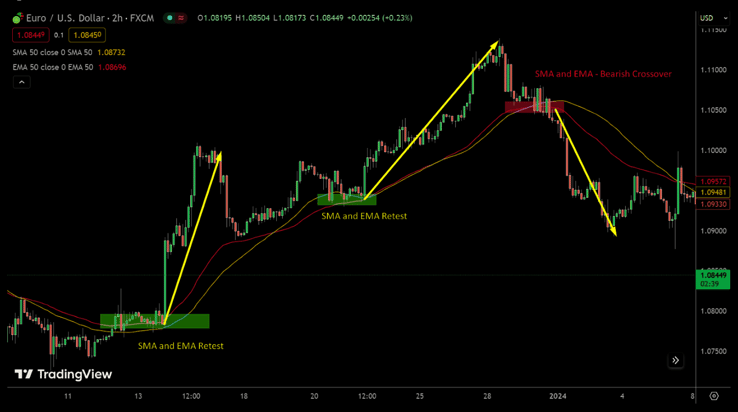
- Examining the EUR/USD chart above, we observe that the EUR/USD pair retested moving averages, namely the 50-period simple moving average (SMA) and exponential moving average (EMA), around the 1.081 support level. Subsequently, as price action closed above this level, forex traders initiated a notable uptrend, propelling the EUR/USD pair towards the 1.1008 level.
- Secondly, when the EUR/USD pair retraced and retested both moving averages again near the 1.0937 level, traders once more seized the opportunity to enter long positions, driving the EUR/USD pair towards the 1.1139 level.
- For the third time, we can discern that the EUR/USD pair managed to breach below both the 50 EMA and SMA lines, along with the formation of bearish candlesticks beneath these EMAs, which in turn triggered a steep downtrend, sending the EUR/USD pair towards the 1.0893 level.
In summary, this demonstrates how these moving averages can assist us in identifying potential turning points and forecasting future price movements.
Sentiment analysis : The pulse of the Forex Market
In the Forex market, sentiment acts as a barometer of collective trader emotions, directly impacting currency valuations. It reflects an intricate blend of reactions to economic news, social media commentary, and fluctuating economic indicators. Today's sentiment analysis leverages machine learning to interpret this complex data, providing traders with a nuanced understanding of market moods.
Currency Values and Trader Emotions : Positive market sentiment can fuel an uptrend, encouraging traders to "go long" and capitalize on the rising tide. On the flip side, a wave of negative sentiment can lead to a market selloff as traders scramble to exit positions and minimize losses.
Sentiment analysis goes beyond dry statistics; it taps into the very psyche of the trading community, where emotions like fear of missing out (FOMO) can drive sudden spikes in activity. For instance, if a currency pair starts to rise rapidly, FOMO can kick in, pushing more traders to buy in haste, further propelling the uptrend.
Developing a Forex market analysis strategy
In the diverse world of Forex, aligning your market analysis strategy with your unique trading style is critical for success.
For example :
- A day trader might leverage short-term price trends and technical chart patterns to make quick, informed decisions within the trading day.
- Conversely, a position trader may focus on long-term economic trends, using fundamental analysis and economic indicators to shape their strategies.
It's essential to continually refine your methods to stay in sync with your trading objectives.
Example of strategic analysis in action : Consider a day trader who spots a bullish flag pattern on the EUR/USD pair. Anticipating a breakout, they might set up a long position just above the flag, with a stop loss below the lowest point of the consolidation.
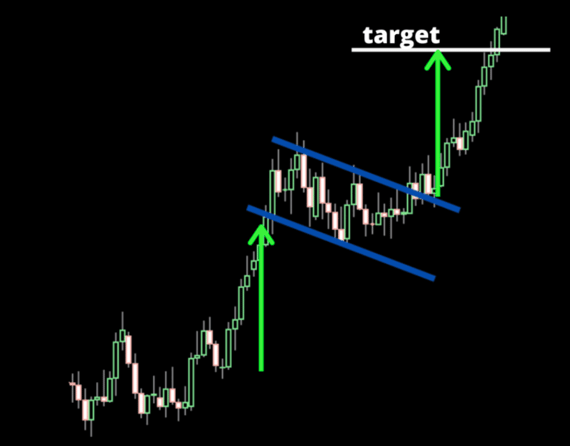
If the breakout occurs as expected, the day trader capitalizes on the quick move. If not, the stop loss helps minimize potential losses, illustrating the importance of a tailored and disciplined approach.
Embracing continuous learning and Market adaptation : The only constant in Forex trading is change. Predicting market movements with certainty is a feat no trader can claim. That's why continuous learning and the willingness to adapt are indispensable. As the market evolves, so must your strategies. Each trading day provides lessons—through both profits and losses—that contribute to a trader's growth and expertise.
Join us on your trading journey
At Flowbank, we're here to educate you through each step of your Forex trading path. With our robust platform and dedicated support, we're committed to helping you understand the markets, manage risks effectively, and trade with purpose and confidence.
Join us at Flowbank, where every trader's journey is valued, and the quest for trading mastery never ends.
