374 days ago
Perspective: #Inflation vs average cycle $SPY $QQQ #stocks #trading
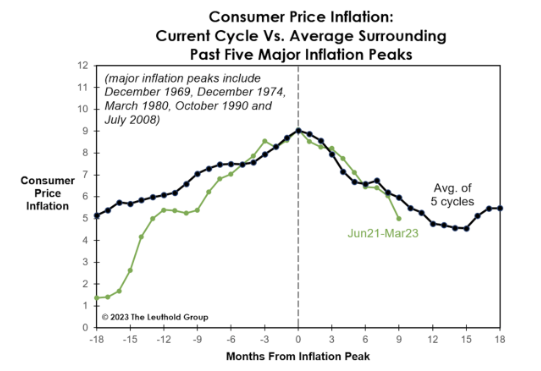
Today is US CPI day. So here is some perspective, even though markets do expect a hot inflation print. Source: Chart from The Leuthold Group
374 days ago
Today is US CPI day. So here is some perspective, even though markets do expect a hot inflation print. Source: Chart from The Leuthold Group
375 days ago
This chart from Barron's is suggesting "Big Money" sentiment is still very much anchored on the low end, from a historical perspective. The chart suggests that stocks tend to recover after an initial market shock that leads to very bearish sentiment. There are a lot of other factors to consider, but that is the historical perspective. Some other indicators do point to a more "neutral" sentiment though. Do you agree about the bearish feeling or has overall investor sentiment recovered by now?

380 days ago
Oil prices tumbled as traders fear the perspective of rapidly falling global demand and ample supplies as traders speculate that Russia didn't reduce output as planned. The market is pricing uncertainty around the OPEC+ cuts given there are some signs Russia seems to have not followed through on the pledged output cuts. So, for oil traders, this should add volatility and make it more difficult to find a market equilibrium. For opportunistic equity investors, it could also offer buying opportunities as stress potentially comes back to oil-related stocks. However, the oil&gas sector may continue to underperform because of the weakening macro backdrop.

381 days ago
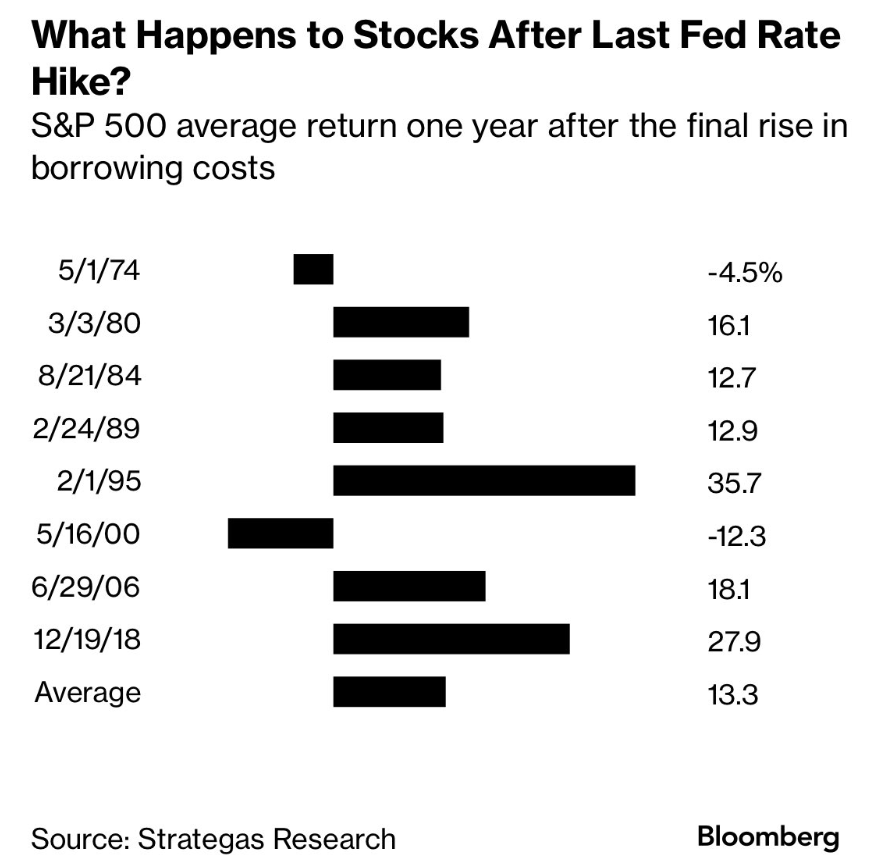
The US Federal Reserve is expected to proceed with its last interest rate hike Wednesday. Here are the average returns for the S&P 500 one year after last hike, in the past. The biggest hurdle in our view is valuations are now expansive. As a result, it is more of a traders's market, perhaps.
382 days ago
The VIX index, which measures the stock market's expectation of volatility based on S&P 500 index options hit its lowest level since November'2021. This is typically a sign that markets are COMPLACENT again. Markets can still climb higher and volatility can sink further, but it is telling investors are not so fearful now. Volatility picks up when traders are nervous, can't decide, and want to only take short-term positions or hedged. That's typically when there are more opportunities for active investors building positions or active traders. (think Mid-march, SVB crisis as an example).