

As the US session approaches on March 8, 2024, traders and investors alike are keenly observing movements in the S&P 500, USD/CAD, and gold markets, amidst a backdrop of significant economic events and earnings reports. The Dollar Index has shown a bearish trend in both the Asian and European sessions, trading at $102.780, with the market's eyes set on the upcoming US Non-Farm Payrolls (NFP). Despite this, the dollar has experienced a stop of over 1% throughout the week, highlighting the currency's volatility and the investors' anticipation of key data releases.

New York, USA skyline | Shutterstock
Asian & European Session's Economic Overview
Recent data releases and economic events have painted a complex picture:
- German Economic Data: Industrial Production exceeded expectations with a 1.0% increase, juxtaposed against a prior -2.0% downturn. Producer Price Index (PPI) also rose by 0.2%, hinting at a gradual economic recovery.
- French Trade Balance: The deficit widened to -7.4B, surpassing forecasts and indicating trade challenges.
- Eurozone Stability: Amidst fluctuating figures, the Eurozone's GDP and employment changes held steady, reinforcing the region's economic resilience.
Getting Ready for US Session
Looking forward, the focus shifts to a series of pivotal events that could steer market sentiment and trading strategies:
- Canadian Employment Change: Forecast at 21.1K, down from 37.3K, could influence USD/CAD dynamics.
- US NFP Report: With expectations set at 198K, down from 353K, the labor market's health remains under scrutiny, potentially affecting currency and equity markets.
- Average Hourly Earnings and Unemployment Rate: Expected to stay flat at 0.2% and 3.7%, respectively, these figures will further color the economic landscape.
Earnings Reports Overview:
- Broadcom (AVGO): Reported earnings of $10.99 per share against a forecast of $10.4, on revenues of $11.96B, hinting at a robust tech sector.
- Costco (COST) and Kroger (KR): Outperform expectations, underlining strength in retail.
- Marvell (MRVL) and MongoDB (MDB): Both companies presented positive surprises, bolstering confidence in tech and database markets.
S&P500 (SPX) Price Prediction: Technical Outlook
The S&P 500 Index (SPX) displayed robust performance, ascending by 1.03% to 5157.35, as market participants keenly anticipate upcoming Non-Farm Payroll (NFP) figures. The index navigates through a bullish trajectory, anchored by a pivot point at 5142.40. Resistance is eyed at successive levels: 5199.64, 5239.33, and 5273.49, delineating potential ceilings for further rallies.
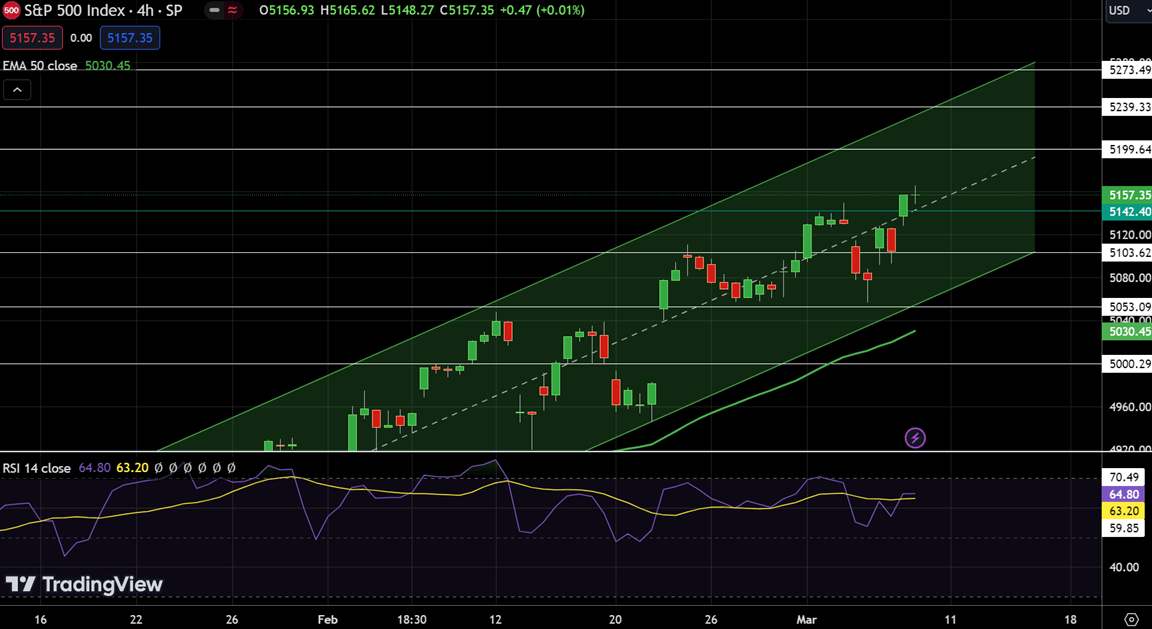
S&P500 Price Chart - Source: Tradingview
Conversely, supports at 5103.62, 5053.09, and 5000.29 provide safety nets against retracements. The Relative Strength Index (RSI) at 64, alongside a MACD indicator showing a bullish crossover at 0.60 against a signal line at 31.92, suggests underlying momentum. The 50-Day EMA at 5030.45 reinforces the positive outlook. However, the appearance of a doji candle signals market indecision, with NFP data likely to catalyze the next significant move.
Trading Signal:
- Entry Price: Buy Stop $5070
- Take Profit: $5120
- Stop Loss: $5035
Start Trading S&P500 Today
USD/CAD Price Prediction: Technical Outlook
In the forex market, the USD/CAD pair is currently trading at 1.34457, reflecting a slight decrease of 0.10%. For those new to forex trading, this means the US dollar has weakened against the Canadian dollar. The key point, known as the pivot point, is at 1.34336. This is a level traders watch closely; if the price goes above it, it may indicate the US dollar is strengthening, while a drop below could signal further weakness.
The currency pair has potential resistance (points where the price might struggle to rise) at 1.34609, 1.34864, and 1.35219. On the flip side, support levels (where the price might find a floor) are at 1.34127, 1.33913, and 1.33652. The RSI, a momentum indicator, is at 24, suggesting the pair might be in an oversold condition—a scenario that could entice buyers.
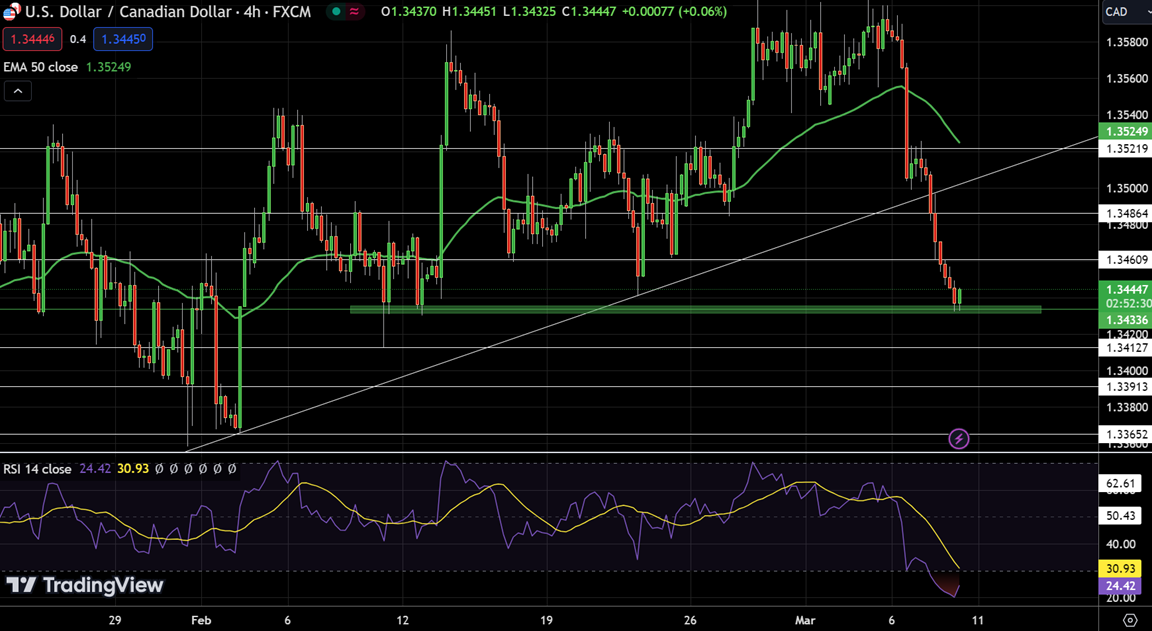
USD/CAD Price Chart - Source: Tradingview
Moreover, the MACD indicator, which helps identify trend reversals, is showing a very slight divergence, hinting at potential changes in momentum. The appearance of a triple bottom pattern at the pivot suggests a strong support level for the Canadian dollar. However, the presence of what looks like a tweezer bottom pattern could pause the current downtrend, possibly pushing prices up.
Traders should keep a keen eye on upcoming Canadian employment data and US Non-Farm Payrolls (NFP) as these could significantly influence the pair's direction. Based on the current setup, a cautious approach would be to consider buying above 1.34300, aiming for a profit at 1.34750, with a stop loss at 1.34100 to manage risk.
Trading Signal:
- Entry Price: Buy Above 1.34300
- Take Profit:34750
- Stop Loss:34100
Start Trading USD/CAD Today
Gold (XAU/USD) Price Prediction: Technical Outlook
The current technical outlook for Gold (XAU/USD) reveals a modest increase, with the price moving up by 0.36% to $2168.155. This upswing reflects a cautious yet growing investor optimism in the gold market. The trading dynamics are framed by a pivot point at $2146.69, suggesting a critical juncture for future movements.
Resistance levels are delineated up to $2229.11, presenting possible thresholds where sellers might emerge. On the flip side, support levels down to $2058.06 offer a safety net against potential declines.
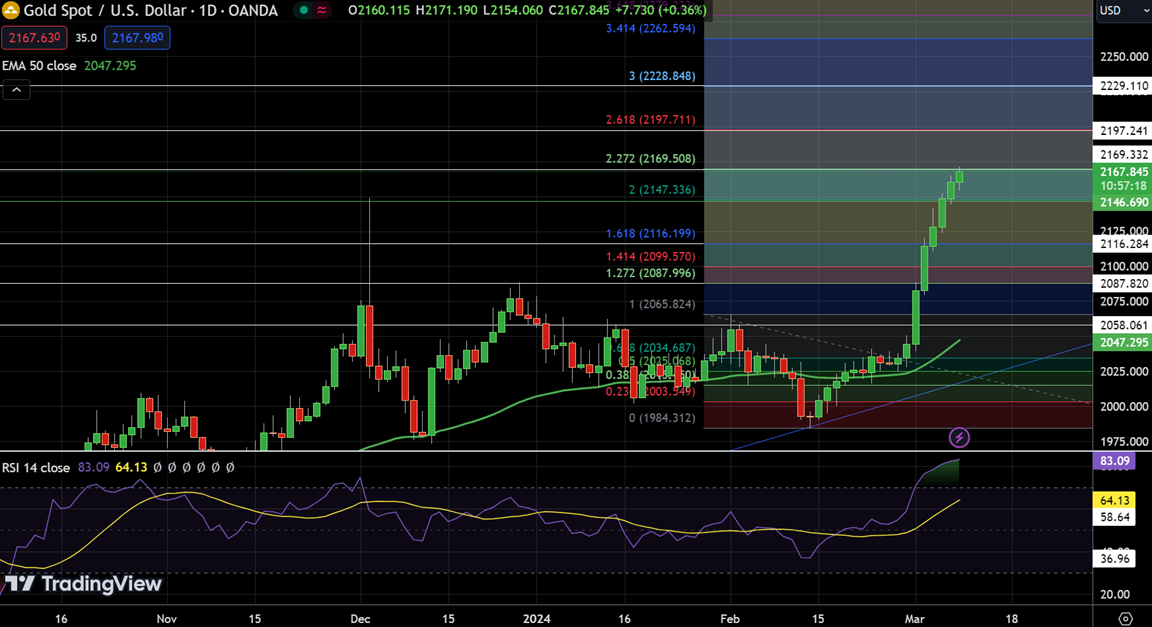
Gold (XAU/USD) Price Chart - Source: Tradingview
Notably, the Relative Strength Index (RSI) stands at 83, indicating an overbought market condition that warrants investor vigilance. The MACD's divergence, marked by a value of -1.0 against a signal line at 20.4, adds a layer of complexity to market sentiment analysis. This is further complemented by bullish patterns, such as 'three white soldiers' and 'bullish engulfing,' observed on the 4-hour timeframe, reinforcing a positive outlook above the pivotal level, albeit with a watchful eye on potential shifts to bearish trends.
Trading Signal:
- Entry Price: Sell Limit $2,170
- Take Profit: $2,185
- Stop Loss: $2,140
Start Trading Gold Today
Stay ahead of market movements. Subscribe for FlowBank’s daily insights and updates!
*The information contained on this page does not constitute a record of our prices, nor does it constitute an offer or solicitation for a transaction in any financial instrument. FlowBank SA accepts no responsibility for any use that may be made of these comments and for any consequences that may result therefrom. Any person who uses it does so at their own risk.

