


On Wednesday, the dollar has shown a bearish demeanor in both the Asian and European sessions, trading at $103.622, reflecting a 0.14% decrease. This movement sets the tone for an intriguing day ahead, especially for key assets like the S&P500, USD/CAD, and Gold.

The inscription SP 500 | Shutterstock.com
Asian & European Session's Economic Overview
During the Asian and European sessions, the financial markets have witnessed a series of economic releases that could set the stage for the upcoming US session. Here's a brief recap of the events and their outcomes:
- Australian GDP: At 0:30, the Australian economy reported a quarterly GDP growth rate of 0.2%, aligning with forecasts but slightly under the previous 0.3%. This indicates a steady, albeit slow, economic expansion.
- German Trade Balance: Released at 7:00, Germany's trade balance significantly exceeded expectations, recording a surplus of €27.5B against the forecasted €21.0B and the previous €23.3B. This suggests a robust export performance, contributing positively to the Eurozone's largest economy.
- UK Construction PMI: At 9:30, the UK's Construction Purchasing Managers' Index (PMI) came in at 49.7, surpassing both the forecast and previous figures of 49.0 and 48.8, respectively. Although still below the 50 mark indicating expansion, it shows a lesser degree of contraction in the construction sector than anticipated.
- Eurozone Retail Sales: By 10:00, the Eurozone reported monthly retail sales growth at 0.1%, consistent with expectations but a recovery from the previous decline of -0.6%. This modest increase suggests consumer spending is holding steady, an essential indicator of economic health.
- UK Annual Budget Release: At 12:34, the UK government presented its annual budget, a pivotal event that likely includes fiscal measures affecting both the domestic economy and financial markets. The specifics of the budget could have implications for GBP trading and broader market sentiment.
These events collectively provide insights into the current state of economic health across major economies. The Australian GDP figures signal ongoing growth, while Germany's trade surplus underscores the country's export strength. The UK's construction sector shows signs of resilience, and stable Eurozone retail sales point to steady consumer confidence.

Display of Stock market quotes | Shutterstock.com
Getting Ready for US Session
- ADP Non-Farm Employment Change at 13:15 is anticipated to show a figure of 149K, a marked improvement from the previous 107K. This data will provide early insights into the labor market's health ahead of the official government employment report.
- Canadian Labor Productivity for the quarter is expected at 13:30, with forecasts suggesting a rebound to 0.2% from a -0.8% contraction. Productivity metrics are crucial for gauging economic efficiency and growth prospects.
- The Bank of Canada (BOC) Rate Statement and Overnight Rate announcement at 14:45, maintaining at 5.00%, will be closely analyzed for future monetary policy clues amidst ongoing inflation concerns.
- Ivey PMI at 15:00, expected to come in at 56.5, serves as a key indicator of the economic health in the manufacturing and services sectors, offering insights into business conditions in Canada.
- Fed Chair Jerome Powell's Testimony also at 15:00, is a pivotal event where investors will search for guidance on the Federal Reserve's future monetary policy moves, especially in light of recent economic data.
- JOLTS Job Openings are forecasted to slightly decrease to 8.80M from 9.03M, shedding light on the demand for labor in the US economy.
- Final Wholesale Inventories at 15:00 are expected to show a contraction of -0.1%, indicating inventory adjustments which can impact GDP estimates.
- Following, the BOC Press Conference at 15:30 will provide further insights into the central bank's views and economic forecasts.
- Crude Oil Inventories at 15:30, with an anticipated increase to 2.4M from 4.2M, will offer clues on energy demand and supply dynamics.
- FOMC Member Daly's Speech at 17:00 and the release of the Beige Book at 19:00 will further contribute to the understanding of the Fed's outlook on the economy.
- NZD Manufacturing Sales at 21:45 and JPY Average Cash Earnings at 23:30 round off the day's events, providing insights into the economic health of New Zealand and wage growth trends in Japan, respectively.
In addition to macroeconomic indicators, today's session will also spotlight a series of earnings reports from notable companies. Among them are:
- Brown Forman is expected to present its earnings, with analysts' consensus pinpointing an EPS (Earnings Per Share) estimate of $0.5643 against last year's performance, alongside revenue projections of $1.13B.
- Campbell Soup will also report its earnings, with expectations set for an EPS of $0.8 against a consensus estimate of $0.77. The company's revenue is forecasted at $2.46B compared to $2.44B, reflecting potential growth.
S&P500 (SPX) Price Prediction: Technical Outlook
In today's technical outlook for the S&P500 (SPX) on March 6, the index saw a decline of 1.02%, closing at 5078.64. The market is navigating through a challenging phase, marked by a pivot point at 5058.68, which serves as a critical juncture for future movements. Resistance levels are identified at 5114.72, 5149.64, and 5191.90, suggesting potential hurdles in the index's upward trajectory. Conversely, support levels at 5012.74, 4982.42, and 4944.75 provide a safety net against further declines.
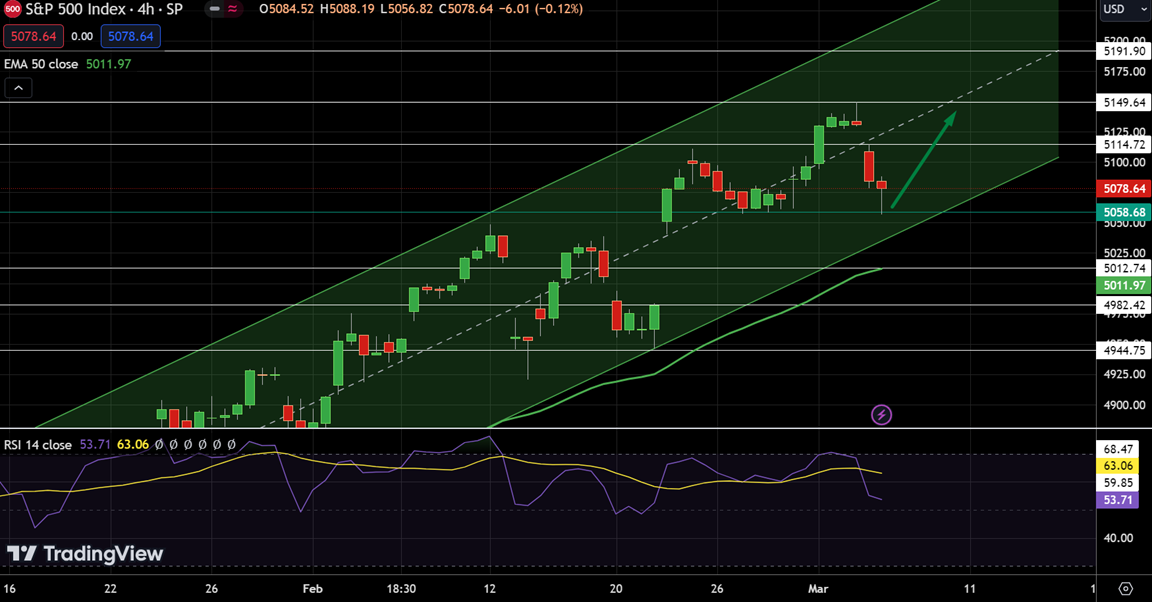
S&P500 Price Chart - Source: Tradingview
The Relative Strength Index (RSI) stands at 53, indicating neither overbought nor oversold conditions, while the 50-Day Exponential Moving Average (EMA) at 5011.97 supports the index's bullish undertone. A notable development is the formation of a hammer candlestick pattern on the 4-hour chart, signaling the weakening of bearish momentum and a potential shift towards bullish dominance.
Given this analysis, the trading signal suggests a bullish outlook for the SPX. Investors are advised to consider buying above the $5058 threshold, with a take-profit target at $5112 and a stop-loss order at $5020, to capitalize on the anticipated upward movement.
Trading Signal:
- Entry Price: Buy Above $5058
- Take Profit: $5112
- Stop Loss: $5020
Start Trading S&P500 Today
USD/CAD Price Prediction: Technical Outlook
The USD/CAD pair slightly decreased by 0.09%, trading at 1.35797. This movement reflects the current cautious sentiment in the market, particularly as traders eye the upcoming Bank of Canada's monetary policy decision. The technical landscape presents an ascending triangle pattern, indicating a bullish momentum for the USDCAD, especially when trading above the 1.3570 level.
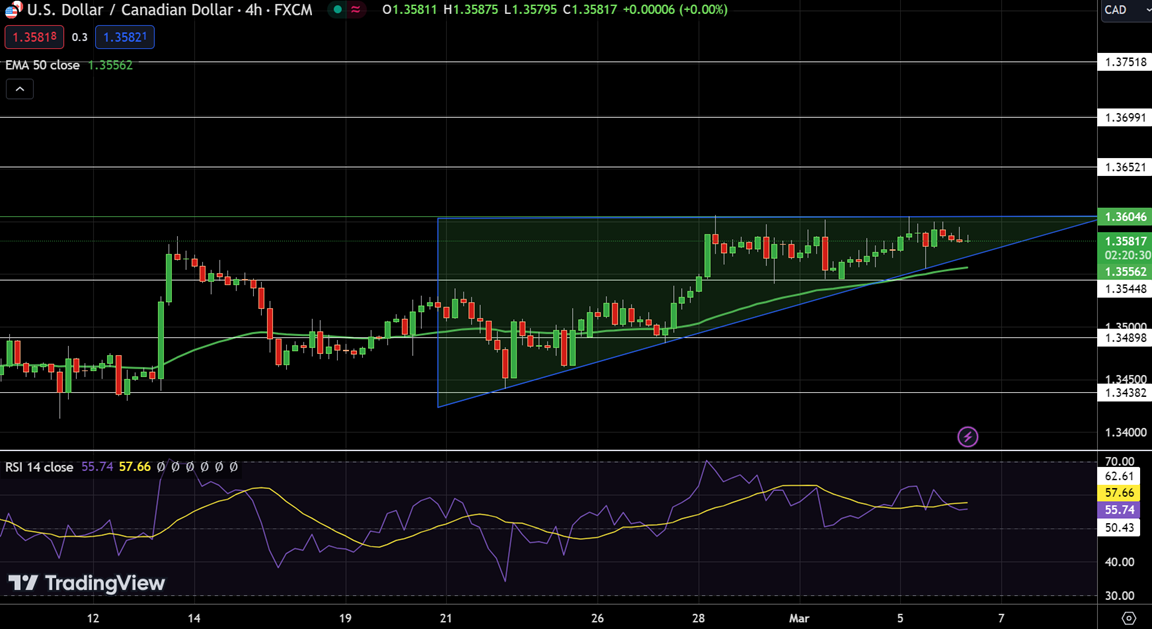
USD/CAD Price Chart - Source: Tradingview
The pivot point stands at 1.36046, acting as a pivotal juncture for future price action. Resistance levels at 1.36521, 1.36991, and 1.37518 outline potential ceilings, while support levels at 1.35448, 1.34898, and 1.34382 offer floors to safeguard against further declines.
The Relative Strength Index (RSI) is at 55, suggesting a balanced market condition. Meanwhile, the 50-Day Exponential Moving Average (EMA) at 1.35562 reinforces the pair's upward trajectory.
However, a triple top pattern around the 1.3605 level could temper the uptrend, necessitating a bullish break above this point to unlock higher levels. Given these dynamics, a trading signal emerges: enter a bullish position above $1.3605, targeting a take profit at $1.3691, with a stop loss set at $1.3545, adjusting for currency scale.
Trading Signal:
- Entry Price: Buy Stop 1.36095
- Take Profit:36533
- Stop Loss:35663
Start Trading USD/CAD Today
Gold (XAU/USD) Price Prediction: Technical Outlook
On March 6, Gold (XAU/USD) modestly appreciated by 0.08%, settling at $2128.770. This subtle uptick is part of a broader context, where Gold is exhibiting a pattern of higher highs on the 4-hour timeframe. The pivot at $2142.12 remains a crucial threshold. Surpassing this level could catalyze further buying momentum, as indicated by the technical setup. Resistance is projected at $2171.86, $2199.47, and $2227.09, delineating potential targets for bullish advancement. Conversely, support levels at $2110.97, $2080.52, and $2051.49 offer foundational backstops against downturns.
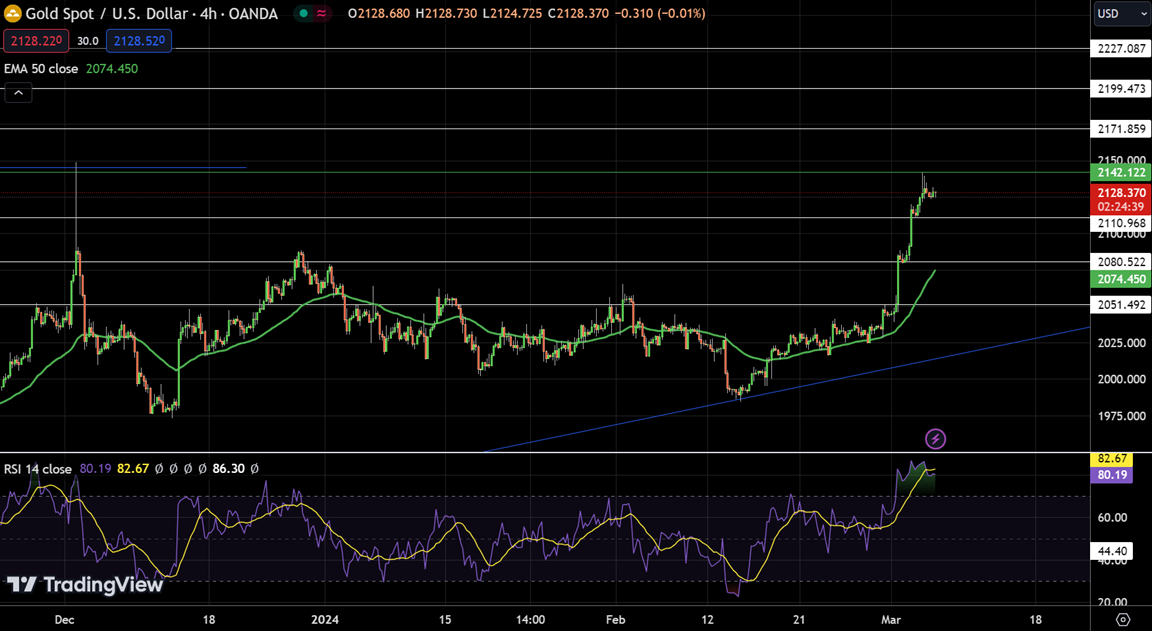
Gold (XAU/USD) Price Chart - Source: Tradingview
The Relative Strength Index (RSI) signals overbought conditions at 80, suggesting heightened buying activity, while the 50-Day Exponential Moving Average (EMA) at $2074.45 underscores a sustained bullish undertone.
Given these observations, the trading signal points to a bullish continuation for Gold. Investors might consider entering positions above $2,125, with an aim for profits around $2,155 and a stop loss at $2,105 to mitigate risk.
Trading Signal:
- Entry Price: Buy Above $2,125
- Take Profit: $2,155
- Stop Loss: $2,105
Start Trading Gold Today
Stay ahead of market movements. Subscribe for FlowBank’s daily insights and updates!
*The information contained on this page does not constitute a record of our prices, nor does it constitute an offer or solicitation for a transaction in any financial instrument. FlowBank SA accepts no responsibility for any use that may be made of these comments and for any consequences that may result therefrom. Any person who uses it does so at their own risk.

