This measure of stock market breadth has hit its highest in a decade. Is that bullish or bearish for stocks?
Must know
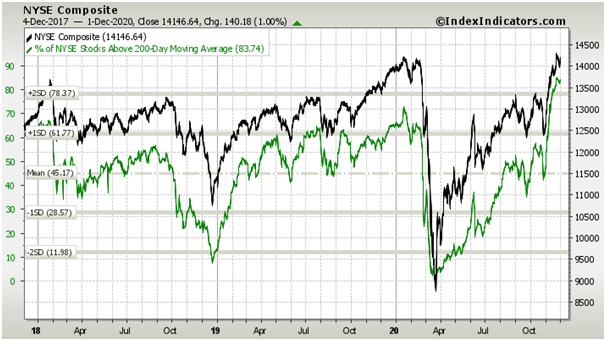
- The percentage of NYSE stocks above their 200-day average has reached 83%, its highest since 2010.
- 2009/10 ushered in a 10-year bull market BUT there was a 20% correction after this indicator last hit this level
- Stocks above the 200 DMA is a measure of market breadth, or how many stocks within a market or index are participating in a move
- Bullish view: the more stocks participating in the rally, the more durable the rally
- Bearish view: sentiment may be getting overcrowded in the short term, meaning a pullback could be due
Chart
S&P 500 vs. Stocks above 200 DMA (MMTH) (10-years)
Definition: Market breadth
Market breath is a measure of how many stocks are rising relative to how many stocks are falling in an index or stock exchange.
It is used by traders to determine the ‘healthiness’ of a market. If lots of the underlying stocks within an index are rising with the index, it is considered a healthier scenario than when just a few stocks are pulling the index higher. When the breadth is higher, it means a drop in the value of a few stocks has less weight on the overall trend of the market.
The 200 DMA
The 200-day moving average is a line drawn on a price chart tracking the average price over the past 200 days, adjusting for each new day by adding the newest value and dropping off the oldest value. When a stock is above its 200-day moving average it is considered bullish and when a stock is below its moving average it is considered bearish.
As can be seen in the below comparison chart, typically rising markets will be characterised by rising market breath. A rising indicator above 50% indicates broad market strength, while a reading below 50% indicates broad weakness.
What about now?
Breadth indicators really only become useful in two circumstances:
- when they start to diverge from the price or
- when they reach an extreme.
The highest percentage of stocks above their 200-day moving average in a decade is noteworthy and can be considered an outlier – or extreme scenario. Stocks and breadth are moving in sync and so there is no divergence.
What does it tell us?
If we think back to what was happening in 2009/10 when this indicator was hitting these levels was that markets were rebounding strongly after the 2008 financial crisis. After the last reading of 83 in MMTH, US stock markets went on to have a 10-year bull market but it had a 20% correction first.
Stock market breadth at this kind of extreme means an underlying strong market that has reached extreme sentiment that could usher in a shorter term pullback. The indicator does not say how big this pullback will be but makes us a little more prepared for it.