

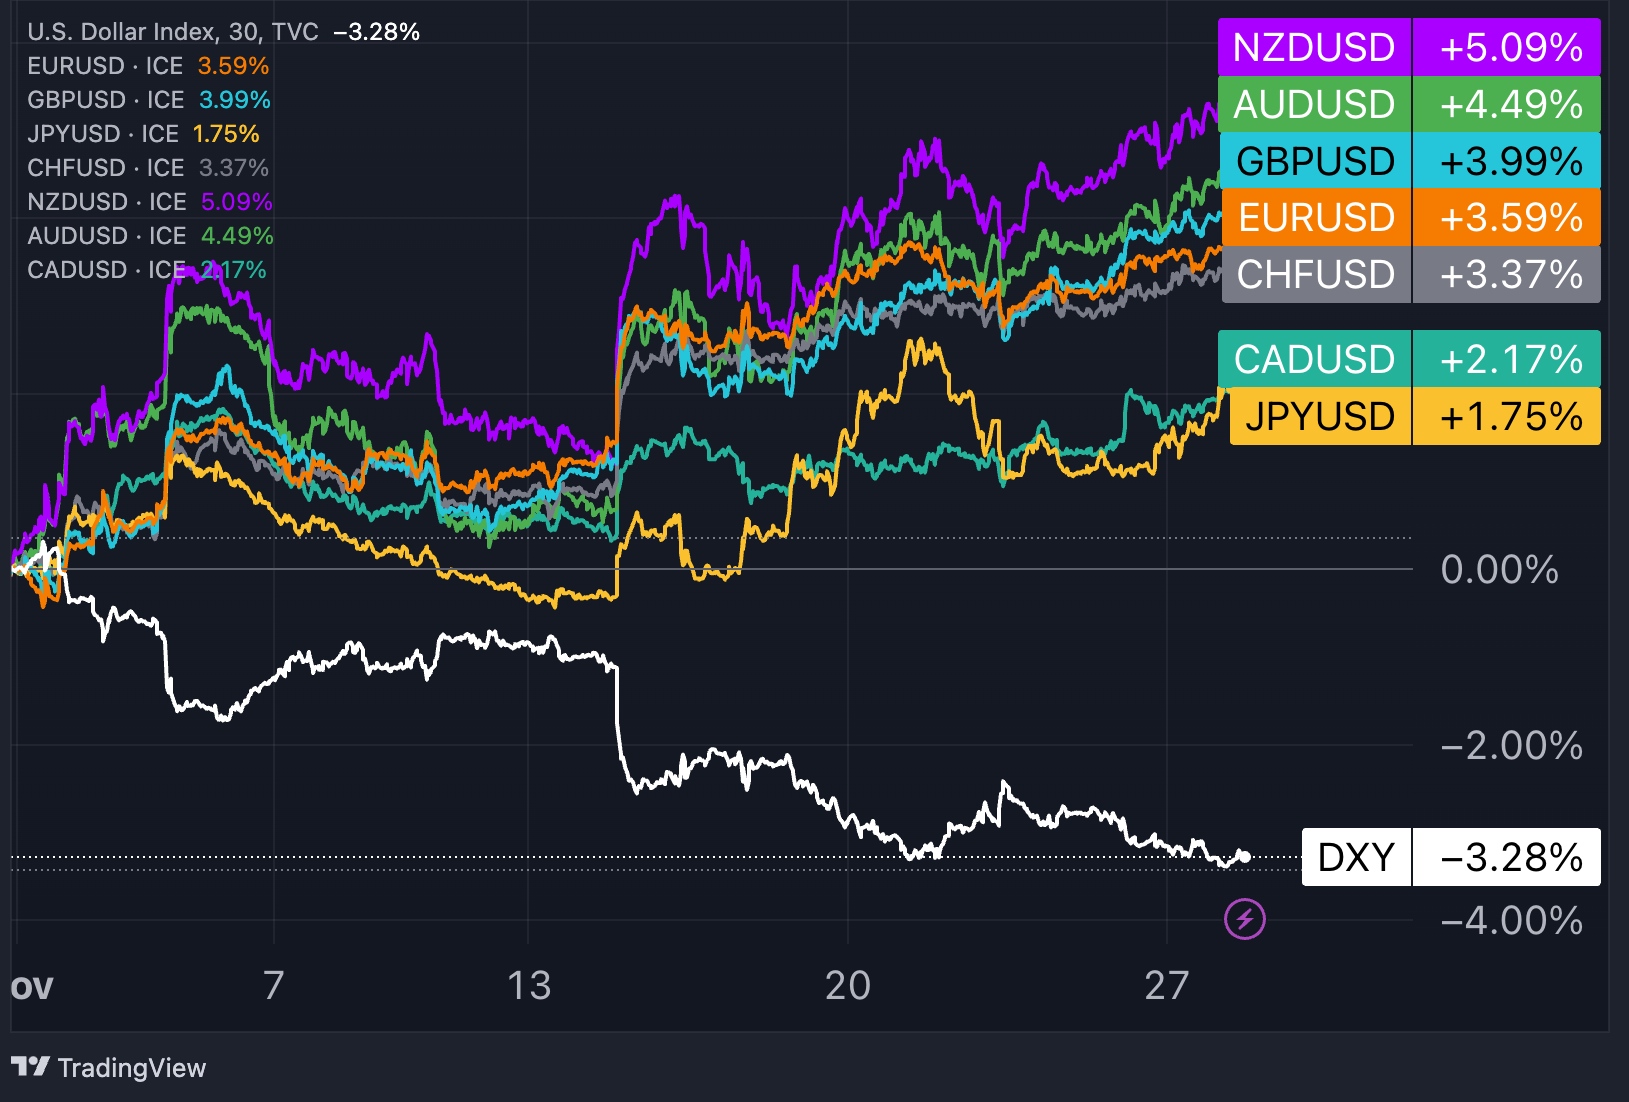
The U.S. Dollar Index (DXY) is currently experiencing its weakest month in the past year, driven by increasing investor speculation that the Federal Reserve has halted its policy of tightening and is poised to begin reducing interest rates as early as May 2024, with four rate cuts currently anticipated for the upcoming year. Yields on U.S. Treasury bonds have significantly declined, reaching levels not observed since mid-September, further eroding the greenback’s fundamental strength.
Month-to-Date Performance of Major Currencies: NZD Strongest, USD Weakest
Forex Market: Week In Review & Week Ahead
The U.S. Dollar Index (DXY) has slipped to 103.25, dropping below the critical 200-day moving average support, which had held up steadily since late August. Month-to-date, the dollar has depreciated by over 3%, marking its poorest monthly performance since November 2022 when it declined by 5%, and ranking as the third worst performance in the past five years. Investors are now eagerly awaiting key economic indicators, including PCE prices (the Fed's preferred inflation measure), personal income and spending data, and the ISM Manufacturing PMI. Additionally, they are looking forward to speeches from several Fed officials, including Chair Powell on Friday, for further insights.
The Euro (EUR/USD) is targeting the significant psychological resistance level of 1.10, a level not seen since early August. ECB officials have attempted to curb speculation about rate cuts, with Bundesbank Chief Joachim Nagel cautioning on Tuesday that if the inflation outlook deteriorates, the central bank may need to consider raising interest rates once more. This week, traders will be assessing a plethora of economic reports from the region, including Germany's GfK consumer sentiment and preliminary Eurozone inflation data, in addition to various ECB statements. Currently, the market is pricing in a 70-basis-point reduction in ECB interest rates by September 2024.
Surprisingly, the British Pound (GBP/USD) has surged above the 1.26 level, reaching heights last observed in early September. This rally is fueled by hawkish remarks from the Bank of England (BoE) and stronger-than-expected economic data, bolstering the cable's strength. BoE Chief Economist Huw Pill emphasized the central bank's commitment to combatting inflation, asserting that there can be no relaxation of its tight monetary policy. Simultaneously, the latest PMI survey indicates the stabilization of the UK's private sector activity in November, surpassing market expectations and concluding a three-month contraction period. Moreover, consumer morale, as measured by the GFK consumer sentiment index, improved in November, exceeding projections. This week, there is limited data directly affecting the pound.
The Japanese Yen (JPY) continues its recent positive momentum, driven by the dollar's overall weakness and declining Treasury yields. The USD/JPY rate has fallen below the psychological 150 mark, currently trading below the 50-day moving average. Latest data reveals that Japan's headline inflation rate accelerated to 3.3% in October from 3% in September, marking the highest reading since July.
The Swiss Franc (CHF) has reached its strongest level against the dollar since late August, propelled by the greenback’s broad depreciation, rising gold prices, and robust employment data in Switzerland. Switzerland's non-farm payrolls increased by 1.9% year-on-year in the third quarter, reaching an all-time high of 5.465 million.
High-beta major currencies, including the Australian Dollar (AUD), Canadian Dollar (CAD), and New Zealand Dollar (NZD), have recently exhibited bullish momentum. Both the AUD and NZD have risen to levels last seen in early August. The Kiwi is now awaiting the Reserve Bank of New Zealand's policy decision this week, with expectations that rates will remain unchanged at 5.5%. Traders will also await OPEC+ meeting on Thursday to assess the outlook for oil-linked currencies.
Key Economic Events for the Upcoming Week
United States:
- PCE Price Index (Thu.): 3% year-on-year (y/y) expected; 3.4% y/y previous
- Personal Spending (Thu.): 0.2% month-on-month (m/m) exp.; 0.7% pre.
- Personal Income (Thu.): 0.2% month-on-month (m/m) exp.; 0.7% pre.
- ISM Manufacturing PMI (Fri.): 47.6 exp., 46.7 pre.
- Powell’s speech (Fri.)
Eurozone:
- November’s Inflation Rate (Thu.): 2.7% exp., 2.9% pre.
- Economic Sentiment (Wed.): 93.7 exp., 93.3 pre.
Others:
- RBNZ Interest Rate Decision (Tue.) 5.5% exp., 5.5% pre.
- OPEC+ Meeting (Thu.)
New Trading Ideas For The Week
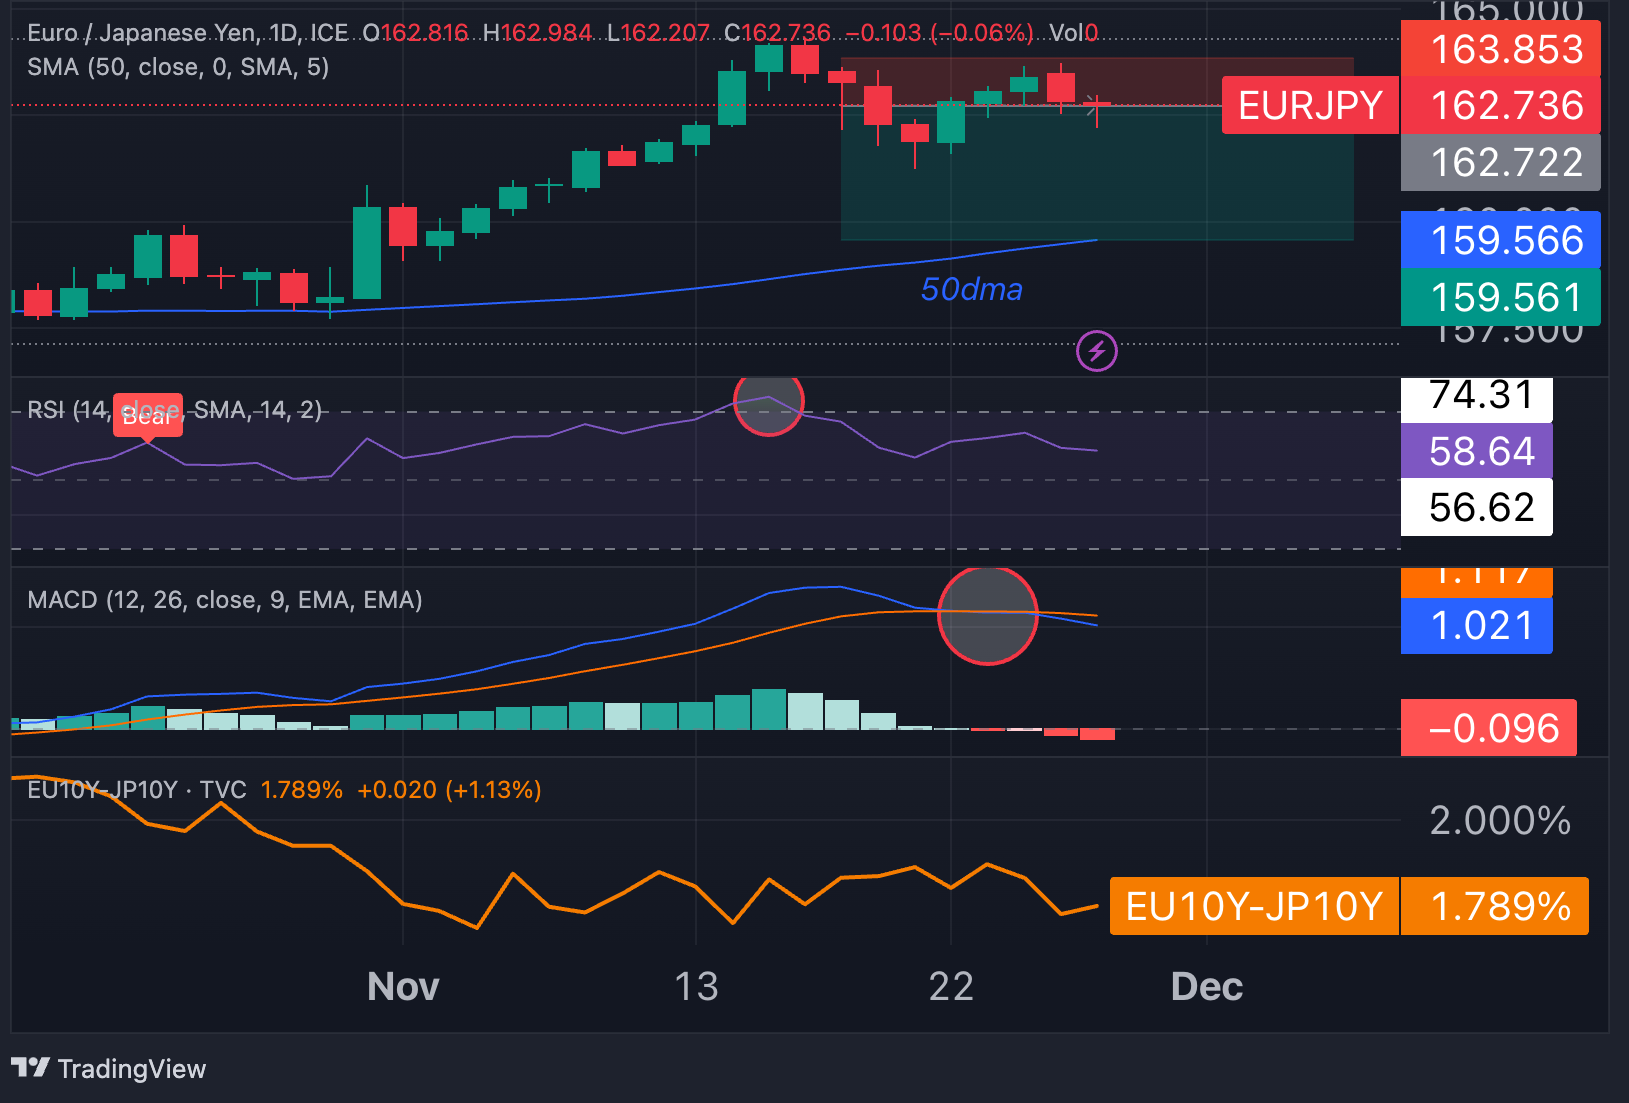
Short EUR/JPY
- Entry: 162.70
- Take profit: 159.56
- Stop loss: 163.85
- Reward/risk: 2.8:1
Fundamental view:
The EUR/JPY exchange rate is currently in a phase that may potentially see a shift in interest rate fundamentals. The yield spread between a 10-year European bond and its Japanese counterpart remained relatively stable in November, hovering around 180 basis points, following a 40 basis point drop in October. If inflation in the Eurozone were to confirm expectations of a decline to 2.7% or even drop below this level, speculators may begin to increase their bets on ECB rate cuts in 2024. In contrast, monetary policy in Japan is expected to tighten, with approximately a 30 basis point increase by the fall of 2024.
Technical view:
EUR/JPY reached topped in mid-November when the Relative Strength Index (RSI) indicated overbought conditions, marking a take-profit signal for bulls. Subsequently, the Moving Average Convergence Divergence (MACD) produced a bearish crossover, triggering a potential sell signal. The remarkable 16% surge year-to-date is the most substantial increase since 2013, and the second-highest since 1989. This significant rally may suggest the possibility of a bullish trend exhaustion. The 50-day moving average support, currently at 159.56, presents an intriguing short-term target, with a recommended stop placed around 163.85.
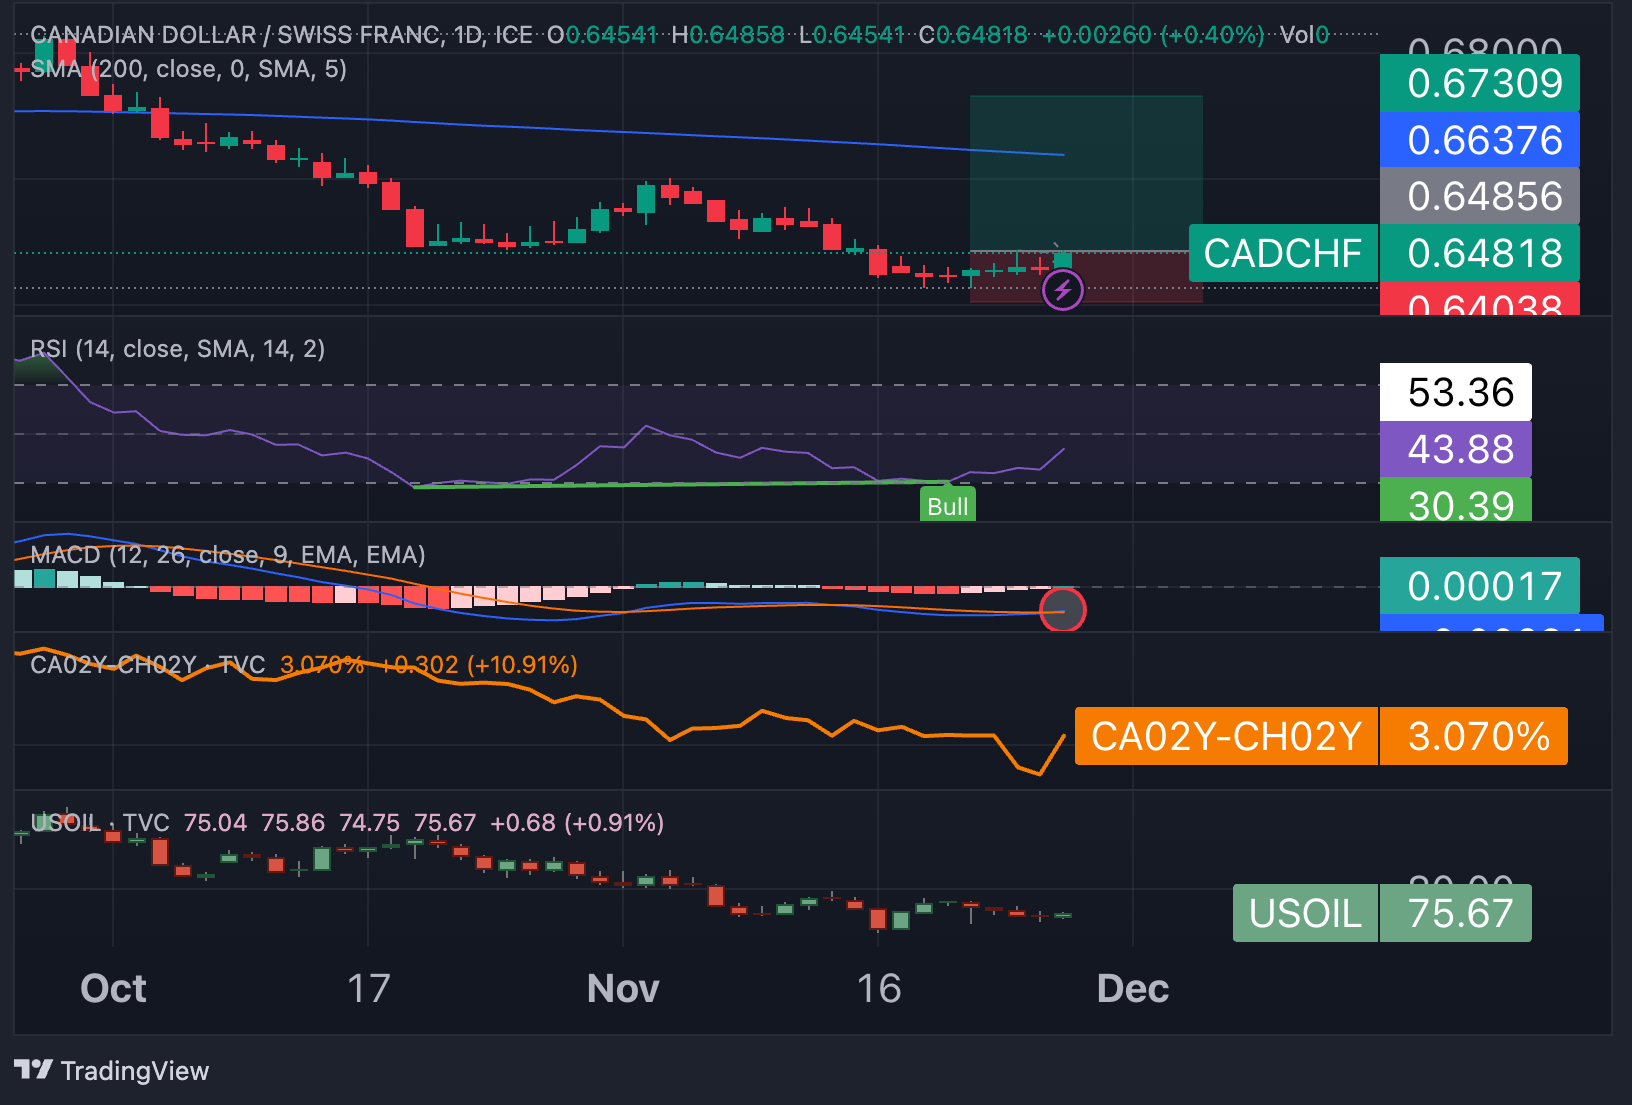
Long CAD/CHF
- Entry: 0.6485
- Take profit: 0.6730
- Stop loss: 0.6400
- Reward/risk: 3:1
Fundamental view:
The CAD/CHF exchange rate has experienced a decline of over 5% since reaching its peak in September, primarily due to the drop in oil prices and diminishing interest rate differentials. However, it's possible that the market's reaction has been excessive, given that the Canadian dollar still maintains a significant yield advantage of over 300 basis points in 2-year bond compared to the Swiss franc. This offers bullish traders a substantial "carry trade" opportunity.
The price of Crude WTI has decreased from $93 per barrel to its current level of $75 per barrel, but there is speculation that OPEC+ may consider further output cuts, which could potentially lead to a resurgence in oil prices. In summary, aggressive and contrarian bulls may begin to identify some factors that could potentially work in favor of the Loonie in the upcoming weeks.
Technical view:
From a technical perspective, CAD/CHF recently exhibited a bullish divergence in the RSI during the past week. This divergence occurred as prices formed a double bottom pattern at 0.6427 on both Monday and Wednesday, while the RSI failed to establish new lows compared to levels seen on October 19th. This divergence suggests that the bearish momentum may pause at this point, potentially paving the way for a resurgence of bullish activity. Additionally, the Moving Average Convergence Divergence (MACD) indicator is approaching a potential bullish crossover. However, it's worth noting that an earlier crossover in November turned out to be a false buy signal. Bullish traders may target a retest of the 200-day moving average, currently at 0.6638. If this level is successfully breached, it could open the door for a potential test of the October highs, situated at approximately 0.6730.
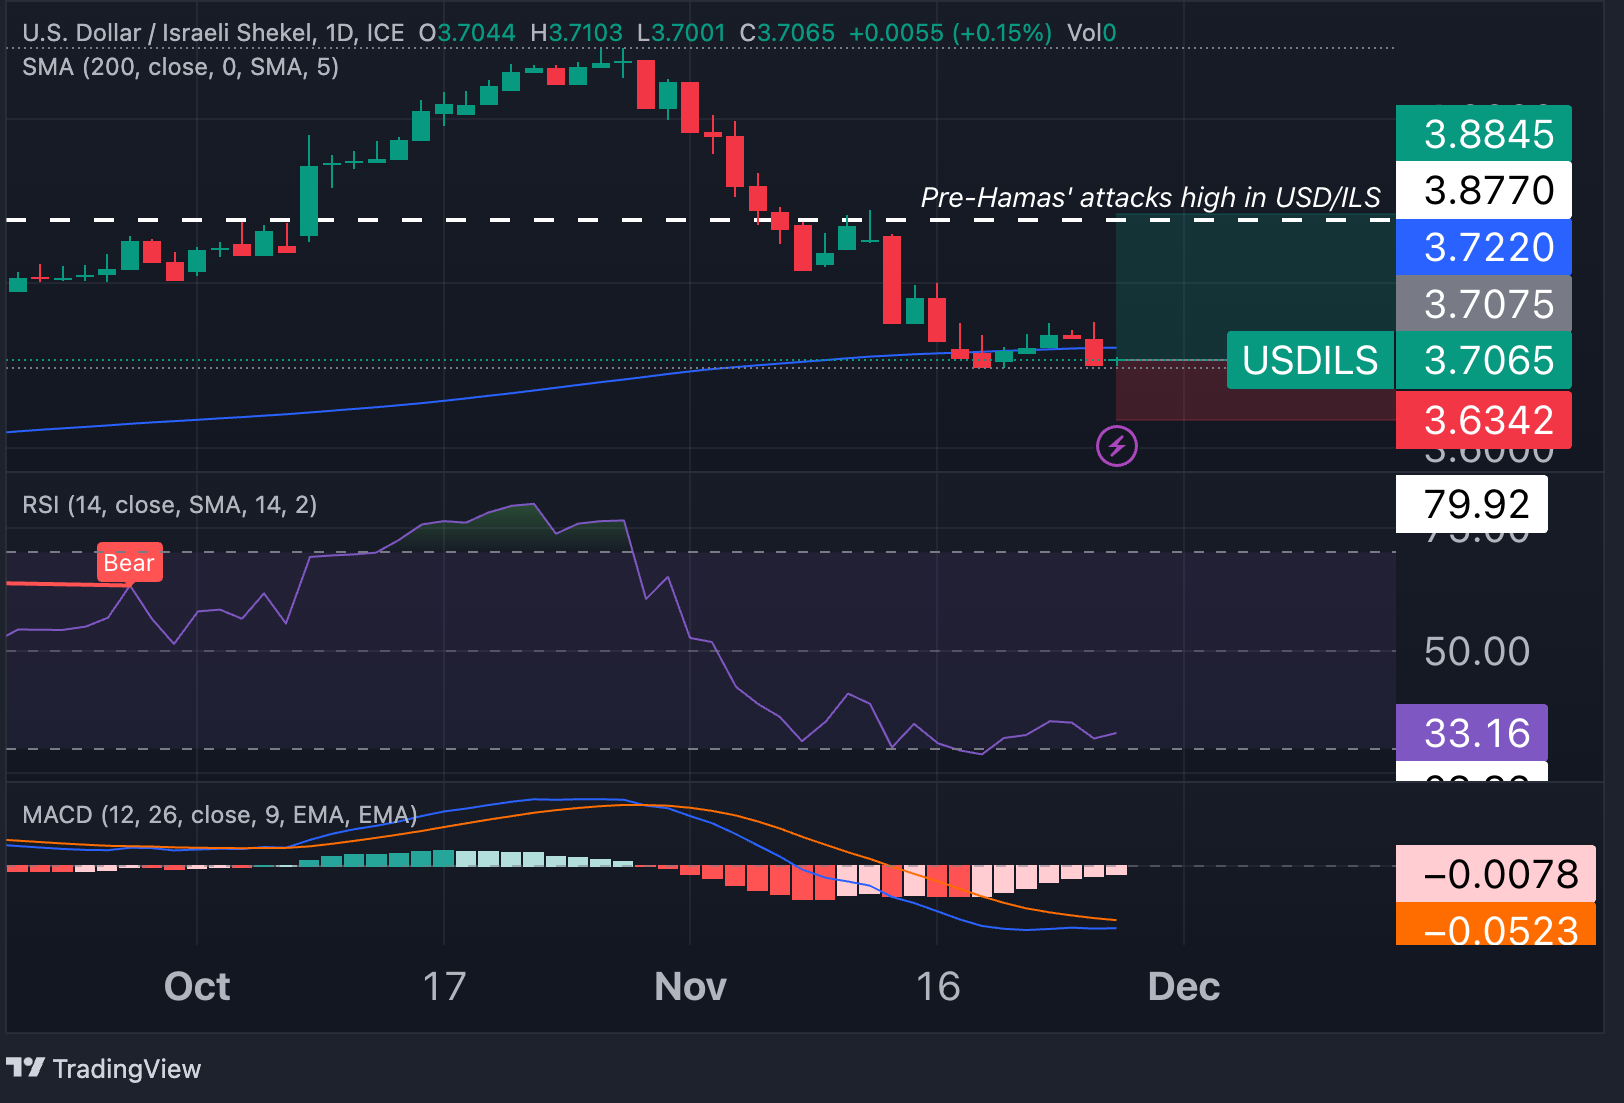
Long USD/ILS
- Entry: 3.7063
- Take profit: 3.88
- Stop loss: 3.6342
- Reward/risk: 2.4:1
Fundamental view:
The Israeli shekel has surged to levels last seen in mid-August, effectively erasing most of the losses that occurred following the attacks by Hamas on October 7th. The Bank of Israel opted to keep its policy rate unchanged at 4.75% during its recent meeting, acknowledging that "the war has significant economic consequences, which impact both real economic activity and financial markets."
The substantial appreciation of the shekel can be attributed to a series of measures implemented by the Bank of Israel to ensure the proper functioning of the markets and to prevent speculative activities against the shekel. However, as the Israeli economy adjusts to the effects of the conflict and aims to rebound from the monthly contraction in economic activity caused by the war, it is possible that some of these measures may gradually be unwound.
It's important to remember that a stronger shekel may not be beneficial from an economic recovery perspective, as it could potentially hinder efforts to stimulate economic growth.
Technical view:
From a technical standpoint, the USD/ILS pair has recently broken below the 200-day moving average support, a level that had held firm since February 2023. Additionally, the RSI has reached oversold territory for the first time since August 2022, indicating the substantial appreciation of the shekel over the past month. After such a wild bearish move, bullish traders may begin to perceive potential opportunities. However, further confirmation could be provided by a bullish RSI divergence, which would occur if prices dip slightly below the lows seen last week at 3.6983. In such a case, a short-term bullish target could be set around the pre-Hamas’ attacks highs at 3.88, implying a potential surge of nearly 5% from the current levels. This level could be an important resistance to watch for potential reversal or continuation patterns in the USD/ILS pair.
Open trading ideas:
- Short EUR/CHF
- Opened on November 18 at 0.9673
- Current Rate: 0.9638
- Updated Profit & Loss: +0.4%
- Short USD/CHF
- Opened on November 18 at 0.8836
- Current Rate: 0.8798
- Updated Profit & Loss: +0.4%
- Short CAD/JPY
- Opened on November 14 at 109.75
- Current Rate: 109.34
- Updated Profit & Loss: +0.3%
- Long EUR/GBP
- Opened on November 14 at 0.8718
- Current Rate: 0.8670
- Updated Profit & Loss: -0.5%
- Long AUD/NZD
- Opened on November 14 at 1.0856
- Current Rate: 1.0856
- Updated Profit & Loss: 0.0%
- Short NZD/CHF
- Opened on November 7 at 0.5327
- Current Rate: 0.5365
- Updated Profit & Loss: -0.7%
- Long XAU/USD
- Opened on October 16 at $1,912/oz
- Current Rate: $2,015 /oz
- Updated Profit & Loss: +5.5%
- Short GBP/AUD
- Opened on September 18th at 1.9250
- Current Rate: 1.9093
- Updated Profit & Loss: +0.8%
- Short EUR/AUD
- Opened on September 4th at 1.6708
- Current Rate: 1.6549
- Updated Profit & Loss: +0.9%
*The information contained on this page does not constitute a record of our prices, nor does it constitute an offer or solicitation for a transaction in any financial instrument. FlowBank SA accepts no responsibility for any use that may be made of these comments and for any consequences that may result therefrom. Any person who uses it does so at their own risk.

