


As the trading session unfolds on March 11, 2024, market participants turn their gaze towards key financial instruments, namely NASDAQ, Gold, and EUR/USD, to decipher the undercurrents shaping the day's trading dynamics. Amidst a backdrop of a bearish dollar during the Asian and European sessions, trading at the $102.695 level, stakeholders are strategically positioning ahead of the upcoming U.S. Consumer Price Index (CPI) announcement. This keen anticipation underscores the dollar's more than 1% decline over the previous week, spotlighting the currency's volatility and its implications across global markets.

Oracle | Shutterstock.com
Since we don’t have any high impact events, the market is likely to price in previously released U.S. Non-Farm Payrolls (NFP) data, which has had a significant impact on market sentiment and strategic positioning.
- The NFP data revealed a robust addition of 275,000 jobs, far surpassing the expected 198,000 and marking a notable increase from the previous 229,000. This vigorous job growth signals a stronger-than-anticipated labor market, potentially influencing Federal Reserve policies and market expectations regarding future interest rate movements.
- The Average Hourly Earnings showed a modest increase of 0.1%, falling short of both the anticipated 0.2% and the prior 0.5%, suggesting a deceleration in wage inflation. This could have mixed implications for inflation expectations and consumer spending power.
- The Unemployment Rate slightly increased to 3.9% from the previous and expected 3.7%, hinting at a more nuanced labor market landscape than sheer job creation numbers suggest.
Getting Ready for US Session
As the day's agenda appears light, the focus intensifies on the U.S. CPI data set for release tomorrow, poised to provide pivotal insights into inflation trends and potentially sway Federal Reserve policy directions. Market forecasters are eyeing:
- Core CPI m/m: Expected at 0.3%, a slight decrease from 0.4%
- CPI m/m: Anticipated to rise to 0.4% from 0.3%
- CPI y/y: Predicted to remain steady at 3.1%
These figures are crucial for traders, especially those new to the forex market, as they offer a lens through which to view the broader economic landscape, influencing strategies across forex, commodities, and equities.
Earnings Reports on the Horizon
In the realm of corporate earnings, notable companies are slated to disclose their financial health this week, including:
- Oracle's earnings on Monday, with the market keenly awaiting its reported EPS against a forecast of 1.38 and revenue expectations.
- The week progresses with earnings from PDD Holdings DRC and Lennar, followed by closely watched reports from Dollar Tree, Adobe, Dollar General, and Ulta Beauty, culminating in Jabil Circuit's announcement on Friday.
NASDAQ (NDX) Price Prediction: Technical Outlook
In today's technical outlook for NASDAQ on March 11, the index observed a decrease, trading at 16085.11, down by 1.16%. The analysis, leveraging a 4-hour chart, identifies a pivotal level at $15996.83. This figure acts as a critical juncture, with immediate resistance levels positioned at $16198.60, $16300.87, and $16441.83, marking potential ceilings for upward movements.
On the flip side, support levels are established at $15866.93, $15723.20, and $15593.30, which could serve as buffers against further drops. The Relative Strength Index (RSI) stands at 52, signaling a neutral market sentiment.
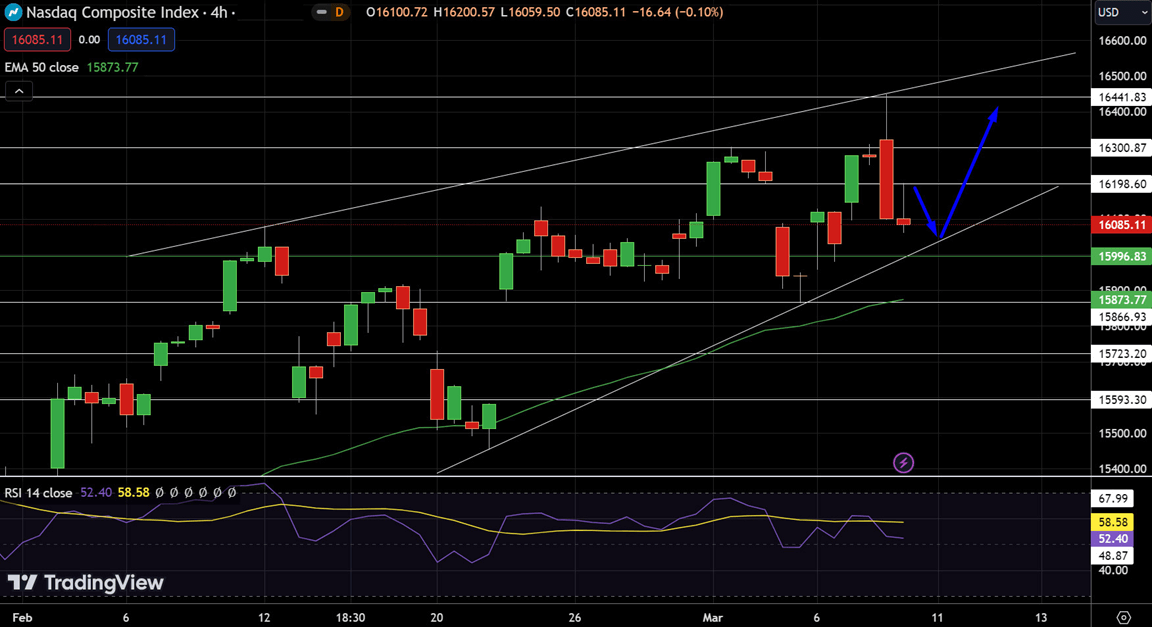
NASDAQ Price Chart - Source: Tradingview
The 50-day Exponential Moving Average (EMA) at $15873.77 indicates a slight bullish undertone. The NASDAQ's trend appears bullish above the $15995 pivot point, suggesting that maintaining levels above this threshold could fend off a sell-off, while a dip below might trigger significant selling pressure.
Trading Signal:
- Entry Price: Buy Stop $5070
- Take Profit: $5120
- Stop Loss: $5035
Start Trading NASDAQ Today
EUR/USD Price Prediction: Technical Outlook
Today's analysis of EUR/USD for March 11 reveals a marginal decline, with the price settling at 1.09376, a 0.03% decrease. The 4-hour chart framework establishes a pivot point at $1.09469. Resistance levels are identified at $1.09615, $1.09815, and $1.09996, presenting potential barriers for upward price movement.
Conversely, support is found at $1.09187, $1.09008, and $1.08791, which could arrest further declines. The Relative Strength Index (RSI) reads at 52, indicating a neutral momentum. The 50-day Exponential Moving Average (EMA) at $1.09120 slightly underpins the current price level, suggesting a mild bullish bias.
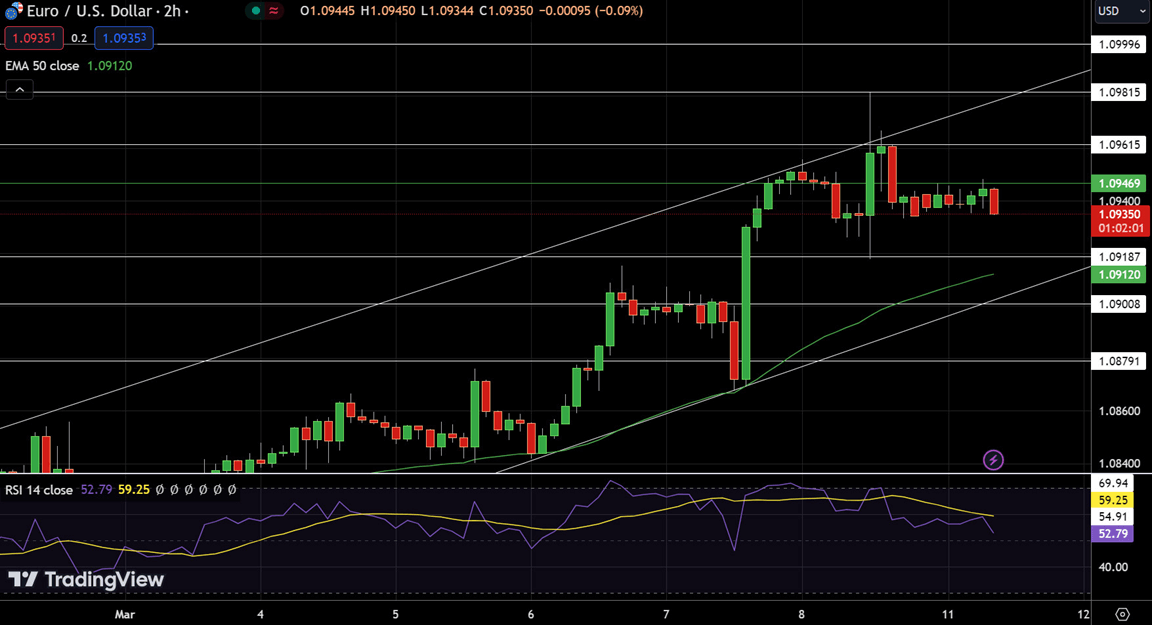
EUR/USD Price Chart - Source: Tradingview
However, the observation of a bearish engulfing candlestick pattern on the 2-hour timeframe, alongside an overbought market condition, hints at a potential bearish correction. Consequently, a strategic approach recommends selling below 1.0936, targeting a profit at 1.0918, with a stop loss placed at 1.0960 to manage risk.
Trading Signal:
- Entry Price: Sell Below 1.0936
- Take Profit: 0918
- Stop Loss:0960
Start Trading USD/CAD Today
Gold (XAU/USD) Price Prediction: Technical Outlook
Today's analysis of Gold on March 11 indicates a slight increase in its price to $2180.495, marking a 0.08% rise. The technical outlook, based on a 4-hour chart, sets the pivot point at $2197. Resistance levels are staged at $2219, $2238, and $2257, delineating potential hurdles for upward price action. Support levels are positioned at $2157, $2131, and $2111, serving as critical points that may contain price dips.
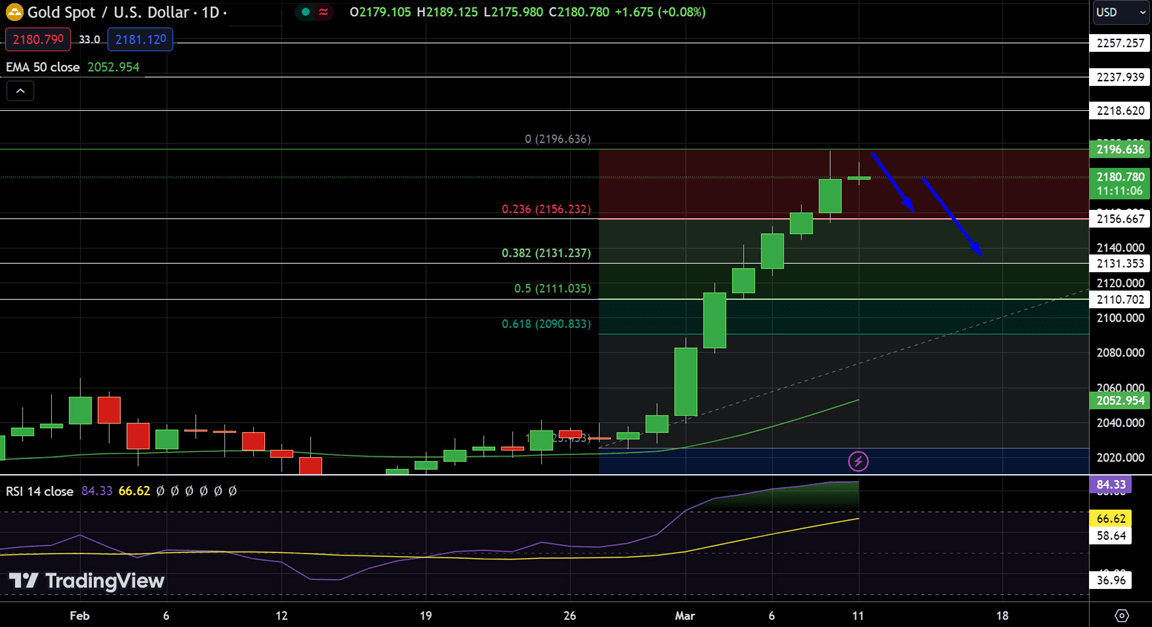
Gold (XAU/USD) Price Chart - Source: Tradingview
The Relative Strength Index (RSI) stands at 84, signifying an overbought condition that may precede a price correction. The 50-day Exponential Moving Average (EMA) at $2053 reinforces a long-term bullish trend. However, the formation of a Doji candle on the daily chart, following a strong bullish trend, signals uncertainty and the possibility of a reversal.
Below $2197, Gold exhibits a significant likelihood of a downturn or at least a bearish correction towards $2156 or $2131. Accordingly, a strategic position suggests selling below $2185, with a take profit target set at $2155 and a stop loss at $2202 to mitigate risk.
Trading Signal:
- Entry Price: Sell Below $2185
- Take Profit: $2155
- Stop Loss: $2202
Start Trading Gold Today
Stay ahead of market movements. Subscribe for FlowBank’s daily insights and updates!

